ЖЭТФ, 2019, том 155, вып. 1, стр. 62-68
© 2019
TOWARDS SOLVING THE MASS-COMPOSITION PROBLEM
IN ULTRA HIGH ENERGY COSMIC RAYS
R. Aloisioa,b*, V. Berezinskya,b**
a Gran Sasso Science Institute
67100, L’Aquila, Italy
b INFN — Laboratori Nazionali Gran Sasso
67100, Assergi (AQ), Italy
Received April 27, 2018,
revised version July 5, 2018.
Accepted July 5, 2018
DOI: 10.1134/S004445101901005X
first calculated in [2] and studied in detail in [3-5].
The dip is well confirmed in the spectra of all three
1. INTRODUCTION
detectors but its origin as the pair-production dip
Mass composition still remains a controversial is-
p+γcmb → p+e-+e+ is now questioned by the Auger
sue in ultra high energy cosmic rays (UHECR). The
mass composition. Before 2011 the data published by
three biggest detectors, Pierre Auger (referred here
HiRes [6] and Auger [7], and later confirmed by TA,
as “Auger”), Telescope Array (referred as “TA”) and
showed high energy steepening in good agreement with
HiRes, have obtained contradictory results concerning
the predicted GZK cutoff.
mass composition of primary particles in the energy
The propagation of UHE nuclei does not leave any
range 3-100 EeV (1 EeV = 1 · 1018 eV). At 1-3 EeV all
clear signature of the mass composition in the energy
three detectors agree with light composition, protons
spectra. The main channel of energy losses, that de-
or protons and Helium, but in the range 3-100 EeV the
termines the spectrum of UHE nuclei is the photo-
Auger detector, the biggest one, founds a progressively
disintegration process on the extragalactic background
heavier mass composition with increasing energy, while
light (EBL) and on CMB. This process naturally pro-
the other two detectors report the mass composition
duces the secondary lighter nuclei, mixing thus with
similar to that at lower energy.
the primary composition. As was first predicted by
At present there are two basic methods to study the
Gerasimova and Rozental [8] in 1961, i. e. before the
mass composition of UHECR: direct measurements and
discovery of CMB, nuclei photo-disintegration on EBL
indirect tests. The more reliable direct method is based
results in a suppression of the UHECR energy spec-
on the observation of the fluorescent light produced by
trum (GR steepening). In fact, as was realised later,
extensive air showers (EAS) in the atmosphere. The
see e.g. [9], a more sharp cutoff occurs at higher en-
indirect test is based on the signatures of mass com-
ergies where the nucleus photo-disintegration time on
position in the primary energy spectrum and we start
CMB becomes equal to that on EBL. This cutoff arises
with it as more old and less constraining.
at Lorenz-factor Γ ∼ (3-5) · 109 for all nuclei. The en-
This approach works most efficiently for protons
ergy of the cutoff Ecut ∝ AΓ is different for primary
due to their interaction with the cosmic microwave
nuclei with different A. This fact together with the un-
background (CMB). It results in two very specific spec-
avoidable mixed composition, due to the production of
tral features: the Greisen-Zatsepin-Kuzmin (GZK)
secondary nuclei makes unclear any composition signa-
cutoff [1] and the pair-production dip. The former
ture in the observed spectrum.
is a sharp cutoff at the end of the spectrum, around
At present the best method to measure the mass
E ≈ 50
EeV, due to the photo-pion production and
composition is given by the observation of fluorescent
the latter is a rather faint feature at E ∼ 1-30 EeV
light produced by the electromagnetic component of
* E-mail: roberto.aloisio@gssi.it
EAS in the atmosphere. All three aforementioned de-
** E-mail: berezinsky@lngs.infn.it
tectors use this method. However, for better accuracy
62
ЖЭТФ, том 155, вып. 1, 2019
Towards solving the mass-composition problem. . .
the fluorescent-light method needs additional informa-
measure Xmax and the same moments-based method
tion, which in the case of HiRes is given by the stereo
for the analysis of mass composition. Why then their
observation of fluorescent light, and in the case of Auger
conclusions differ? The most convincing answer to this
(and recently of TA) this additional information is ob-
question is probably given in a recent paper by the
tained from the data of on-ground detectors (water-
TA collaboration [12]. The observation of fluorescence
Cherenkov detectors in Auger and scintillation detec-
light can be performed in two ways: with a monocular
tors in TA).
observation, when only one telescope observes the flu-
The basic observable parameter related to mass
orescent signal, or in the stereo mode when more than
composition is Xmax(E), the atmospheric depth where
one telescope simultaneously observe the same shower.
the number N(E) of particles in the cascade, with to-
Fluorescence detection in monocular mode is less effi-
tal energy E, reaches its maximum. Xmax, is sen-
cient to measure Xmax in comparison with the stereo
sitive to the number of nucleons in the primary nu-
mode. HiRes and later TA used, apart from monoc-
cleus. Heavy nuclei interact higher in the atmosphere
ular, also stereo events with higher precision in the
and have smaller fluctuations. In practice the actual
measurement of Xmax. It became possible because of
quantity which allows to find the mass composition is
the smaller (in comparison with Auger) spatial separa-
the distribution N(Xmax) of the showers with total en-
tion between telescopes. Auger, on the other side, to
ergy E.
cover a larger area has a much larger separation among
In the case of large statistics the direct use of
telescopes and collected mainly monocular fluorescent
N (Xmax, E) gives the most reliable estimation of com-
events. Instead, the Auger collaboration elaborated the
position. In the case of limited statistics one may use
hybrid technique, first proposed in [13], based on ad-
the moments of this distribution, see e. g. [10], namely
ditional accompanying signal from, at least, one on-
the first moment which is the mean value 〈Xmax〉 and
ground water-Cherenkov detector. Hybrid method al-
the second moment σ(Xmax) which is the variance or
lows to measure the core location and geometry of the
dispersion (RMS) of the distribution. As was demon-
shower, which improve the measurement precision for
strated in [11] using only the first two moments for the
Xmax and shower energy E. Auger collected now the
analysis, may result in a false degeneracy: two different
largest number of hybrid events and we compare our
mass compositions may produce the same 〈Xmax〉 and
predictions with the hybrid Auger data whenever this
σ(Xmax).
is possible.
The shape-fitting analysis of N(Xmax) recently per-
At present TA is also using the hybrid technique
formed by the Auger collaboration [11] gives very im-
with the help of 507 on-ground scintillation detectors
portant results that, summarising, can be described as
[12]. With an accumulated statistics of 5 years data,
follows. The mass composition is assumed as a discrete
TA reports [12] that the hybrid measurements of Xmax
sum of four elements: Iron (Fe), Nitrogen (N), Helium
agree with the results of Auger, if analysed with the
(He) and protons (p). For each element the Xmax dis-
EPOS-LHC hadronic interaction model [14]. On the
tribution is calculated by Monte Carlo (MC) simula-
other hand, using the QGSJet II-03 hadronic interac-
tions and the fraction of each element in the total flux
tion model [15] the TA collaboration founds a mass
is found from the comparison with observations. These
composition compatible with only light nuclei.
fractions depend on the models of hadronic interaction
Another important method to measure the mass
included in MC simulations. A decisive result is given
composition is given by the observation of muons pro-
by the very small fraction of Iron at all energies, al-
duced in the EAS.
most independently of the hadronic interaction model
The basic effect to distinguish a nucleus from a pro-
(see the upper panel of Fig. 4 in [11]). Besides, the
ton with the help of muons is related to the different
analysis of [11] shows that the fraction of light elements
energy per nucleon, E/A, at fixed total energy E. A
(p+He) is quite large independently of the hadronic in-
low energy nucleon produces low energy charged pi-
teraction model. It allows the conclusion that at least
ons which decay to muons before the parent pion un-
a large fraction of UHECR, if not the dominant one,
dergoes new collisions with air-nucleus. Produced in
is composed by light elements. The small fraction of
the EAS, muons propagate rectilinearly with velocity
Iron and large of p + He seem to be a common con-
v ≈ c. As a result they can provide directional and
clusion of the N(Xmax) shape-fitting analysis of Auger
timing informations, which can further reduce uncer-
and HiRes/TA data.
tainties in the fluorescent method. There are two well
The argument above does not dismiss the question:
known muon quantities relevant for measuring mass
Auger, HiRes and TA use the same fluorescent data to
composition: The total number of muons in the shower
63
R. Aloisio, V. Berezinsky
ЖЭТФ, том 155, вып. 1, 2019
Nμ and the so-called muon production depth (MPD)
In two recent papers by the Auger collaboration, the
Xμmax, which gives the atmospheric depth where the
mass-compositions obtained using moments-analysis
production rate of muons reaches its maximum [16-18].
[10] and shape-fitting N(Xmax) analysis [11] are not
The new exciting method of muon detection in
identical. Realistically, they are not expected to be
Auger experiment is given by the Auger-Prime [19] up-
such, similarly to the already known fact that 〈Xmax〉
grade, recently funded, has been specifically designed
and σ(Xmax) give, if analysed separately, somewhat
to improve muon detection in the whole energy range
different results. The shape-fitting analysis is obvi-
of the experiment. Each water-Cherenkov tank will
ously the most fundamental and most sensitive method,
be equipped with scintillator layer on the top, sensi-
since, for example, it involves the tiny parts of the wing
tive only to e-m component of the shower, while water-
distribution. Apart from it, the shape-fitting analysis
Cherenkov detector is sensitive to both e-m and muon
demonstrated a degeneracy effect when two different
components. The combination of the two signals allows
mass compositions correspond to the same first two
to reconstruct each of the fluxes separately. Recently,
moments. For this reason, in the present paper, we
also the TA collaboration started important upgrades
choose the results obtained from the shape-fitting anal-
to increase the statistics at the highest energies enlarg-
ysis of the Auger data [11] with the measured fractions
ing the area covered by the surface detectors, an up-
of four nuclei species: Fe, N, He and p. These frac-
dated description of the status of the TA experimental
tions, as determined from Auger measurements [11],
set-up can be found in [20].
reveal some uncertainties due to different hadronic in-
teraction models namely QGSJet [15], EPOS-LHC [14]
In the present extended-abstract we use the lat-
and Sibyll [21].
est Auger and TA observations, comparing them with
the spectral features that arise due to propagation of
The important result obtained in [11] is given by
a very small fraction of Iron at all energies and for all
UHECR, and their mass composition.
interaction models, except EPOS-LHC at the two high-
We argue that the spectral features may still be con-
est energy bins (see the upper panel in Fig. 4 of [11]).
sidered as an indication for a light mass composition,
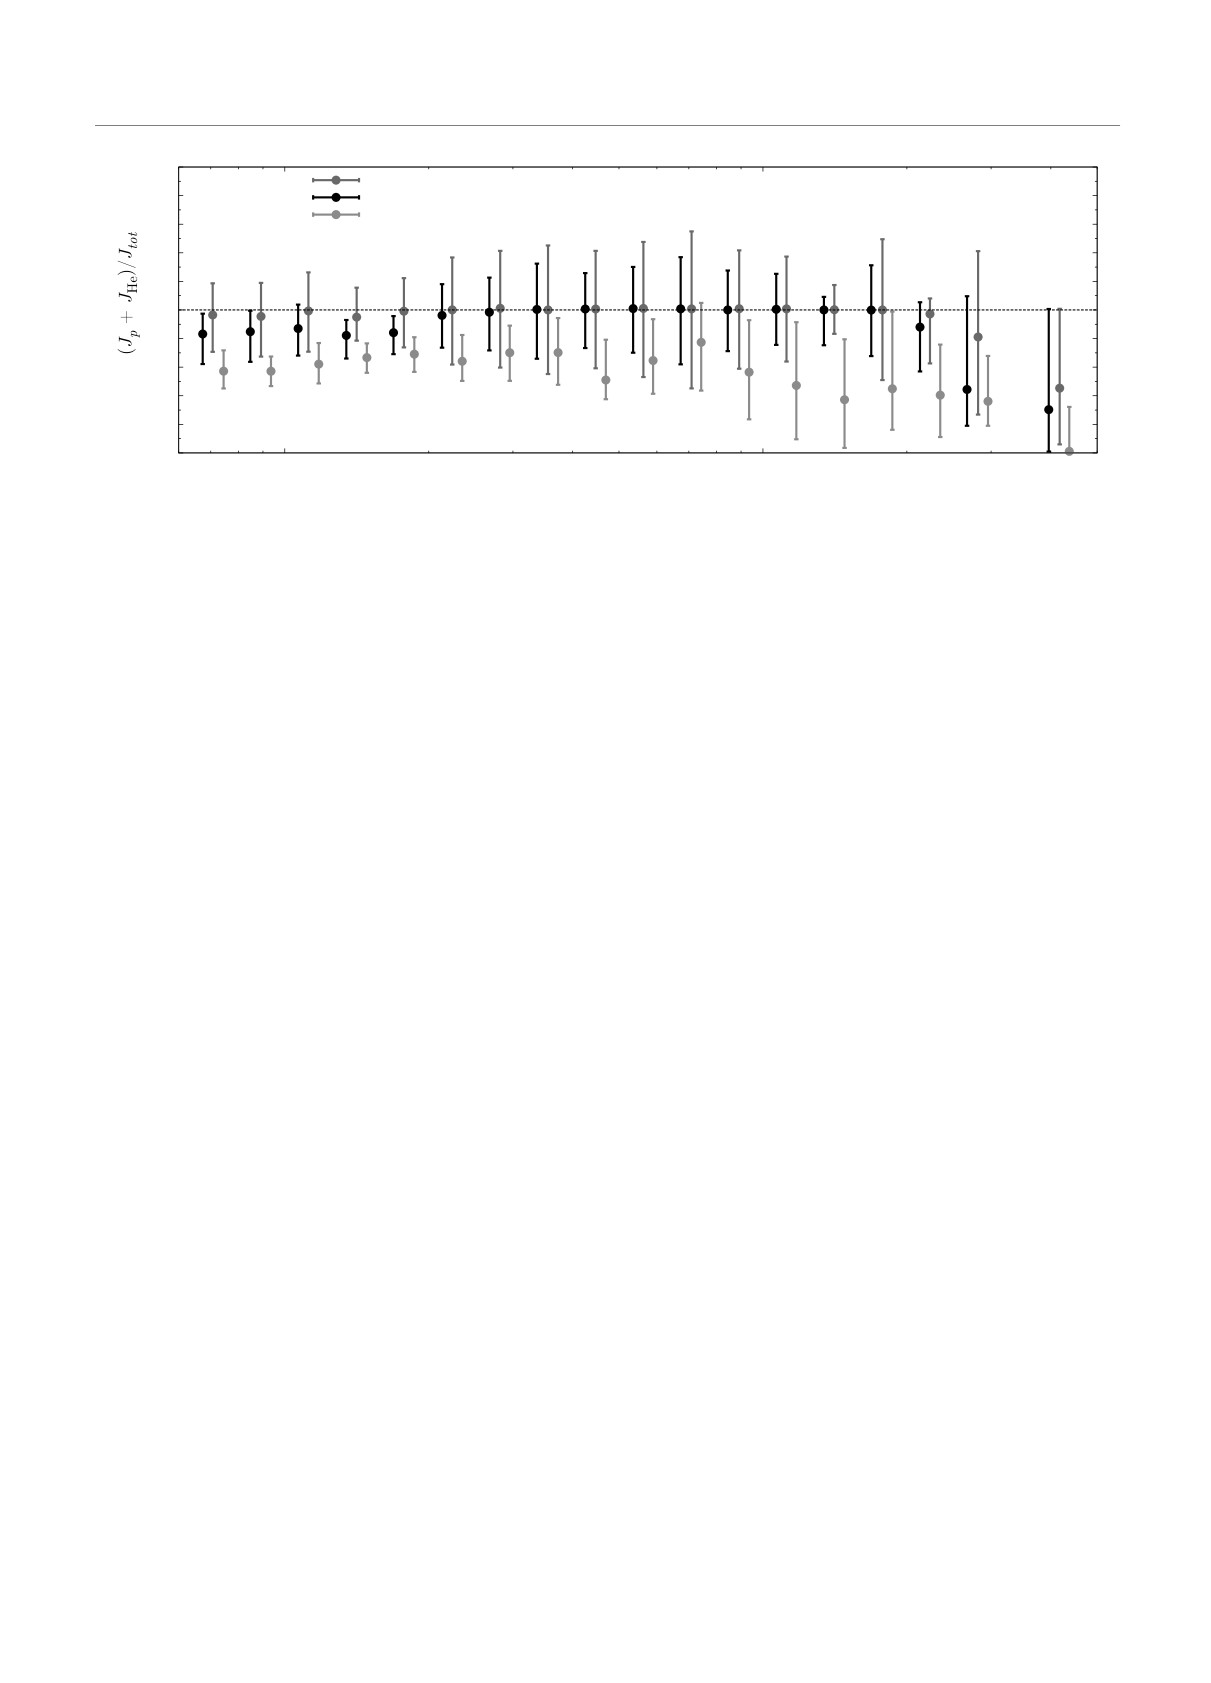
The other important result, as mentioned in Introduc-
solving the problem of the alleged discrepancy between
tion, and exposed in Fig. 1, is a large fraction of p+He,
Auger and TA observations.
consistent with unity.
The extended-abstract is organised as follows: in
It is interesting to note that both effects have a nat-
Sec. 2 we show how a mixture of Helium nuclei and
ural cosmological explanation.
protons provide a good description of the observed flux.
Among the heaviest nuclei, Iron is the most natural
The conclusion is given in Sec. 3.
element to be produced in Supernova (SN) explosions
and the absence of Iron in UHECR implies that other
2. p + He MODEL
heavy elements must be absent too. Their suppression
As discussed in the Introduction there is some ten-
in the form Fe/p ≪ 1 is very natural for extragalac-
sion on the mass composition at E > 3 EeV between
tic gas and extragalactic cosmic rays. Enhancement of
the three biggest UHECR experiments Auger, TA and
p + He component has the same nature.
HiRes. In this Section we first summarise the basic
At the cosmological epoch of recombination, pro-
physics of mass-composition measurements, then dis-
tons and Helium nuclei were the dominant compo-
cuss the influence of cosmological environment and, fi-
nents and heavy metals were almost completely absent.
nally, present calculations relevant to the p+He model.
Meanwhile, the production of metals is compulsory. It
The measurement of mass composition is based on
is needed to provide cooling of ordinary stars during
the Xmax value, which is the depth of the atmosphere
their evolution, including the preSN phase. The later
where the number of particles in the shower reaches its
stage of reionization in the Universe, as detected by
maximum. The value of Xmax is a basic parameter to
WMAP [22] and Planck [23] satellites occurs at red-
determine the mass composition of UHECR, with the
shift z = 11.0 ± 1.4 and z ≲ 10.0, respectively. This
best observable quantity for this determination given
stage needs at least two early generations of stars with
by the shape of the distribution N(Xmax, E) for show-
low metallicity, Pop III and Pop II stars. They inject
ers with fixed total energy E.
into the extragalactic space a small amount of heavy
As a matter of fact, until recently, instead of the
metals. The main contribution to the Iron observed in
distribution N(Xmax), the first two moments of this
the extragalactic space (and thus in extragalactic cos-
distribution were used: the mean value 〈Xmax〉 and its
mic rays) is given by the present-time SN explosions.
RMS σ(Xmax).
This scenario is confirmed by WMAP and Planck ob-
64
ЖЭТФ, том 155, вып. 1, 2019
Towards solving the mass-composition problem. . .
2.0
QGSJet II-4
1.8
Sibyll 2.1
EPOS-LHC
1.6
1.4
1.2
1.0
0.8
0.6
0.4
0.2
0
1018
1019
E, eV
Fig. 1. (Color online) Fraction of p + He nuclei relative to the total one according to the Auger measurements [11] with error
bars (summed in quadrature) taken from Fig. 4 of [11] using hadronic interaction models: Sibyll 2.1 (black), QGSJet II-4 (blue),
and EPOS-LHC (red)
servations of the Universe reionization and by the ob-
We are ready now to calculate the energy spectra
servations of Lyα forest which indicate that extragalac-
for p + He models and to compare them with spec-
tic space had very low fraction of heavy elements at the
tra released by Auger and TA in 2015. We consider
level Z ∼ 10-3.5Z⊙ at redshift z ∼ 5, see e. g. [24]. Iron
a power-law generation spectrum as Q(E) = KiE-γg
and other heavy metals are injected into extragalactic
(i = p, He) with the same generation index γg for pro-
space mainly during a short interval Δz at z ∼ 0 mostly
tons and Helium nuclei. We also assume that sources
due to explosions of the last generation of SNe. This
are distributed homogeneously and uniformly, so that
scenario is similar to the model of UHECR produced
the calculated spectrum is universal, i. e. not being af-
mostly nearby our Galaxy [25].
fected by propagation models. Energy losses include
pair-production, photo-pion production, and photo-
One may conclude that Hydrogen and Helium as
dissociation for Helium on CMB and EBL.
the main products of primordial cosmological nucle-
Secondary protons from He and D photo-dissocia-
osynthesis, and suppression of SN-produced Iron and
tion and also from neutron decays are included in cal-
other heavy metals in red-shifted gas, naturally result
culations. For interaction with EBL photons the model
in a p + He dominated extragalactic gas and UHECR
[26] is used. In all these calculations we follow [27].
accelerated at red-shift z ≥ a few.
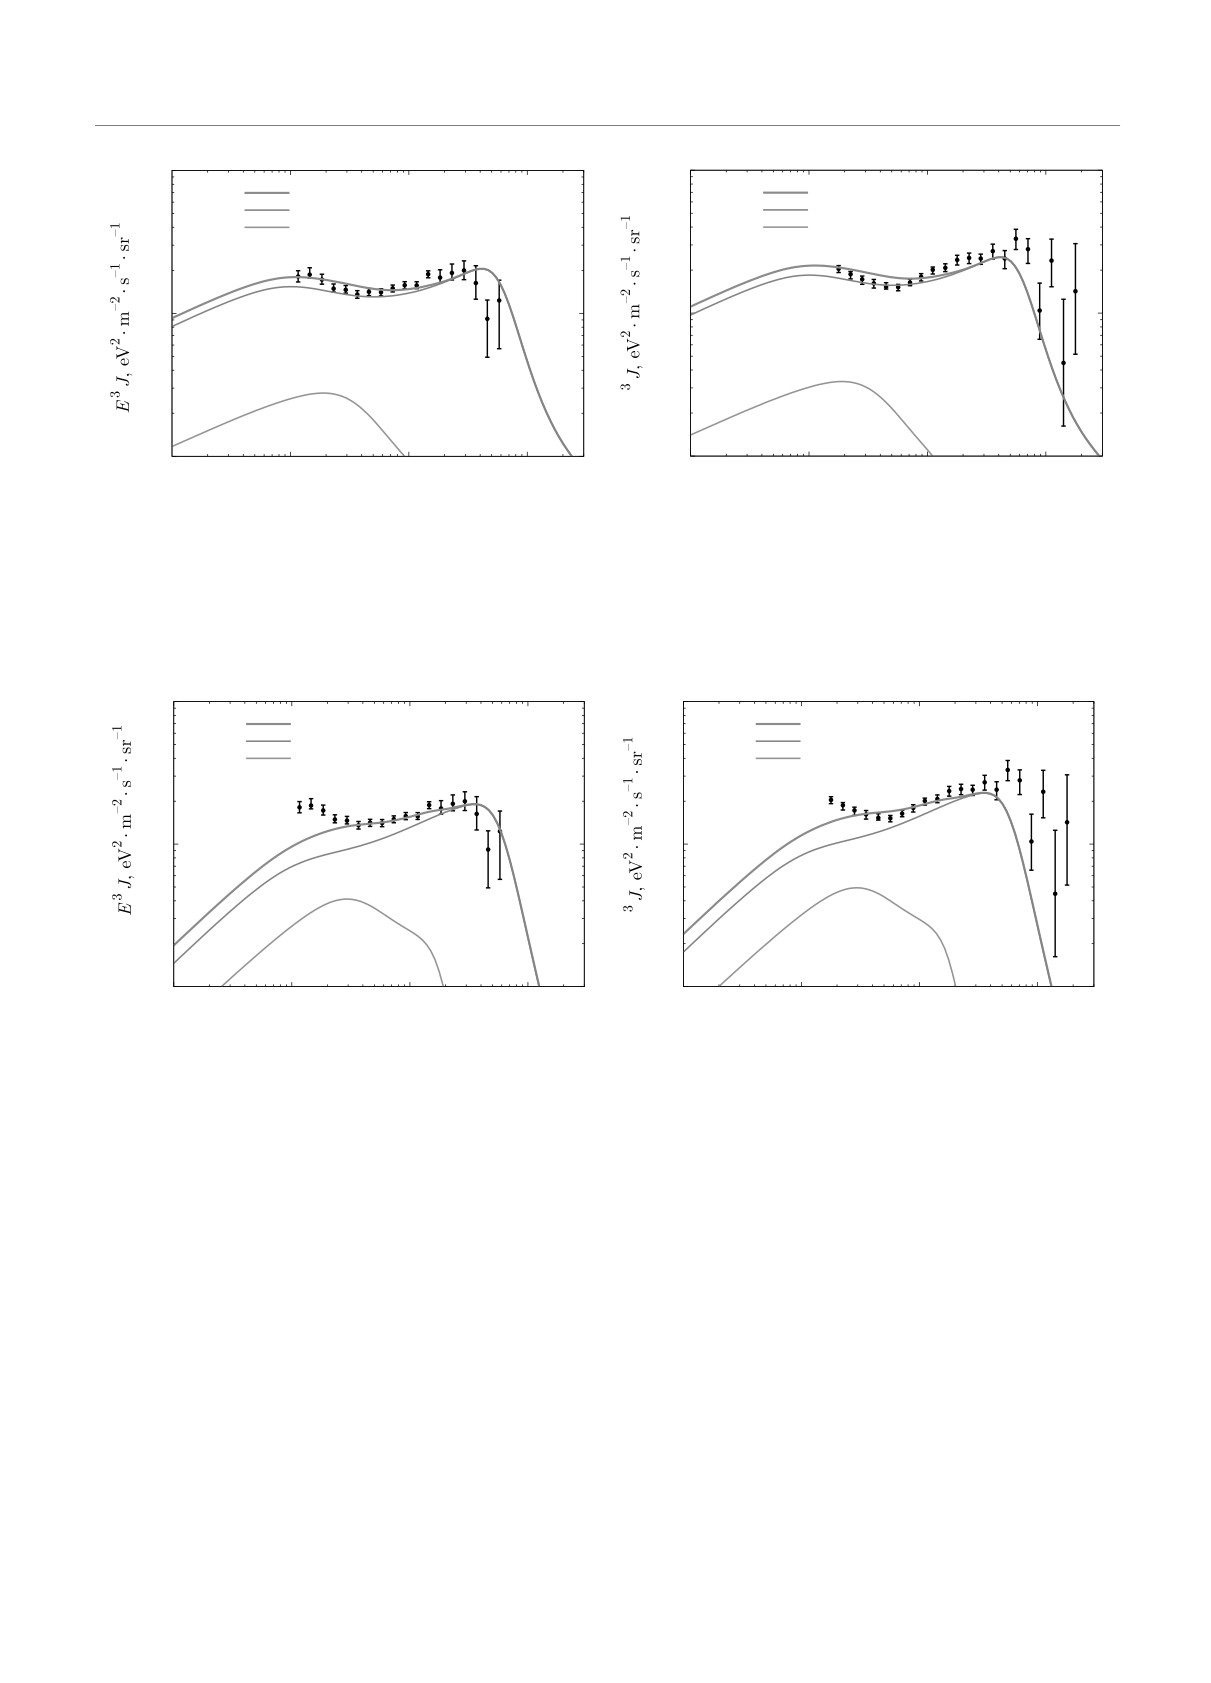
In Fig. 2 and Fig. 3 the computed spectra for p+He
models are presented for γg = 2.6 and γg = 2.2, respec-
In our calculations an additional simplifying as-
tively. A generic feature of p + He spectra is the pro-
sumption is used. Generically, we assume that all exist-
ton dominance at the highest energies because of the
ing detectors do not distinguish reliably Helium from
GR steepening for Helium at E ≲ 5 · 1018 eV due to
proton and one can consider p + He flux as a single
photo-disintegration on EBL. Therefore the GZK cut-
light component, assuming the fraction He/p as a free
off in p + He model becomes compulsory, unless the
parameter of the model. However, we will start with
maximum acceleration energy Eaccmax is below the GZK
the sum p + He as it comes from Fig. 4 (strip 3 for He
threshold EGZKmax ≃ 50 EeV.
and strip 4 for p) of [11]. Summing these two fractions,
with errors summed in quadrature, we obtain p + He
Consider first the case of generation index γg = 2.6
flux presented in Fig. 1. One can see that the sum of
shown in Fig. 2. This generation index corresponds
these two components saturates well the total flux, at
to the canonical proton modification factor in the dip
least in the case of QGSJet and Sibyll hadronic inter-
model [3-5]. Therefore if to take a small He/p ratio at
action models. This interesting fact confirms well our
generation one should obtain the theoretical spectrum
assumption that the light fraction (p + He) weakly de-
and theoretical modification factor in agreement with
pends on energy and with good accuracy saturates the
old (before 2015) observations. One may notice from
total flux leaving small room for other components (e. g.
Fig. 2 the similar agreement between theoretical and
N which will be considered later as CNO component).
observational dips for Auger 2015 (hybrid data) and
65
5
ЖЭТФ, вып. 1
R. Aloisio, V. Berezinsky
ЖЭТФ, том 155, вып. 1, 2019
1025
1025
Auger Hybrid Spectrum 2015
Total
Total
TA Combined Spectrum 2015
21
p
= 2.6,
E
= 10
eV,
p
g
max
L
= 1.2
L
He
He
TA
Auger
K /K
= 0.15
He
p
1024
1024
b
a
23
10
1023
1017
1018
1019
1020
1017
1018
1019
1020
E, eV
E, eV
Fig. 2. (Color online) a) Energy spectrum for mixed p + He composition with injection index γ = 2.6, Eaccmax = 1021 eV and
He/p = 0.15 in the generation spectrum. The contribution of He is shown by magenta curves, proton by green and total by red.
The calculated spectrum is compared with hybrid data of Auger 2015. b) As in panel a in comparison with TA combined data.
The agreement needs a rescaling of the total flux by a factor 1.2. One may notice the excess of TA flux at energy above the
GZK cutoff
1025
1025
Auger Combined Spectrum 2015
Total
Total
TA Combined Spectrum 2015
19
p
= 2.2,
E
= 8. 10
eV,
p
L
= 1.2
L
g
max
TA
Auger
He
He
K /KHe = 0.35p
a
b
1024
1024
23
10
1023
1017
1018
1019
1020
1017
1018
1019
1020
E, eV
E, eV
Fig. 3. (Color online) The same as in Fig. 2 but for γg = 2.2, Emax = 8 · 1019 eV and a ratio of protons and Helium nuclei at
the source He/p = 0.35
for TA 2015 (combined data). This agreement becomes
from Fig. 2, it seems not well reproduced in both data
worse at the highest energies.
sets. Auger shows an earlier cutoff at energies below
the GZK cutoff energy (≃ 50 EeV) while TA shows a
In Fig. 2 we plot the comparison of the observed
flux suppression at energies slightly higher than this
and calculated fluxes for Auger 2015 (a) and TA 2015
value.
(b). It is remarkable that, at the dip energies, the TA
spectrum can be described just rescaling by a factor
The fraction of Helium allowed at the sources de-
1.2, which is the source emissivity needed to describe
pends on the assumptions for the injection power-law
the Auger data. The behavior of the flux at the high-
index. Assuming harder spectra it is possible to in-
est energies is determined by the photo-pion production
crease the fraction of Helium. In Fig. 3 we assume a
process. The maximum acceleration energy in Fig. 2 is
maximum acceleration energy Emax = 8 · 1019 eV and
taken at the level of Emax = 1021 eV. In other words,
a flatter injection spectrum with γg = 2.2, that allows
the theoretical spectrum shape in Fig. 2 is exactly as
to increase the fraction of Helium nuclei in the gener-
predicted in the case of the GZK cutoff and, as follows
ation spectrum up to KHe/Kp = 0.35. This procedure
66
ЖЭТФ, том 155, вып. 1, 2019
Towards solving the mass-composition problem. . .
improved but a little the agreement with observational
In the case of γg = 2.6 the observed dip is mainly
data of Auger at the highest energies, while the good
produced by protons: it is the canonical case of the dip
agreement with the dip remains practically as before.
model [3-5].
These changes are linked with the GR steepening of
In the case γg = 2.2 the dip at EeV energies of
He spectrum due to photo-disintegration on the EBL
the spectrum is produced by both Helium and proton
radiation.
components. However, the observed high energy cutoff
in the Auger spectrum is located at energy below the
3. CONCLUSIONS
predicted GZK cutoff. In any case the shape of the
spectrum alone is not enough to accept the model.
We conclude emphasising that the understanding
As far as mass composition is concerned there
reached so far on the mass composition of UHECR
are three methods to analyse the fluorescence data:
is still not conclusive.
The observations of mass
〈Xmax〉, σ(Xmax) and the shape-fitting analysis of
composition are still contradictory and cannot exclude
N (Xmax) distribution [11]. As it is well known, the
a pure light composition, while the observations of
first two methods (moments of the Xmax distribution)
spectra agree fairly well with such hypothesis. For
do not agree well between themselves and both disagree
these reasons the high energy muon program of Auger,
with the shape-fitting analysis (compare the mass com-
especially the measurement of Xμmax(E), will be a
position obtained in [10] and in [11]). In this paper
crucial test of the models discussed in this paper.
we used the Auger shape-fitting analysis as the most
reliable and free from false degeneracies, see [11] and
The full text of this paper is published in the English
Introduction.
version of JETP.
In the shape-fitting analysis the mass composition
is described in terms of four nuclei species: p, He, N (we
REFERENCES
consider it as CNO) and Fe (which can be considered
as Iron group including the heavy metals). The results
1.
K. Greisen, Phys. Rev. Lett. 16, 48 (1966); G. T. Zat-
sepin and V. A. Kuzmin, JETP Lett. 4, 78 (1966).
of this analysis are given as fractions of the fluxes of
these four elements, which depend rather strongly on
2.
G. R. Blumenthal, Phys. Rev. D 1, 1596 (1970).
the hadronic interaction models used. The new and im-
3.
V. Berezinsky, A. Gazizov, and S. Grigorieva, Phys.
portant result of this analysis is the very small fraction
Rev. D 74, 043005 (2006).
of Iron, compatible with zero, practically for all models
of hadronic interactions. We argue that this result is
4.
V. Berezinsky, A. Gazizov, and S. Grigorieva, Phys.
natural for the standard cosmology with reionization of
Lett. B 612, 147 (2005).
the Universe.
5.
R. Aloisio, V. Berezinsky, P. Blasi, A. Gazizov, S. Gri-
Our first observation is that using QGSJet II-4 and
gorieva, and B. Hnatyk, Astropart. Phys. 27,
76
Sibyll 2.1 for the hadronic interaction model the sum
(2007).
of protons and Helium nuclei fractions saturates with
6.
T. Abu-Zayyad et al., Phys. Rev. Lett. 92, 151101
good precision the total flux, while for EPOS-LHC it
(2004).
leaves more space for other elements especially at the
lowest and highest energies. Thus, a reasonable model
7.
J. Abraham et al., Phys. Rev. Lett. 101, 061101
could be a p + He dominated injection.
(2008).
Next, we made the ad hoc assumption that at
8.
N. M. Gerasimova and I. L. Rozental, JETP 41, 488
present all existing detectors cannot distinguish reli-
(1961).
ably Helium nuclei from protons and we calculated the
9.
R. Aloisio, V. Berezinsky, and S. Grigorieva, Astro-
spectra for Helium and protons considering them as a
part. Phys. 41, 94 (2013).
single component with the same injection power-law in-
dex γg equal to 2.6 and 2.2 and taking the ratio He/p
10.
A. Aab et al. (Auger Collaboration), Phys. Rev. D 90,
at the source to fit the spectra of Auger and TA. These
122005 (2014).
ratios are 0.15 for γg = 2.6 and 0.35 for γg = 2.2. The
11.
A. Aab et al. (Auger Collaboration), Phys. Rev. D 90,
calculated spectra are shown in Figs. 2 and 3. The
122006 (2014).
highest energy part of these spectra are always dom-
inated by protons, because high-energy He nuclei are
12.
R. U. Abbasi et al. (TA Collaboration), Astropart.
photo-disintegrated in collisions with EBL photons.
Phys. 64, 49 (2015).
67
5*
R. Aloisio, V. Berezinsky
ЖЭТФ, том 155, вып. 1, 2019
13. T. Abu-Zayyad et al. (HiRes-MIA Collaboration),
20. R. U. Abbasi et al. (TA Collaboration), Astrophys.
Astrophys. J. 557, 686 (2001).
J. 858(2), 76 (2018).
14. K. Werner, F. M. Liu, and T. Pirtoj, Phys. Rev. C 74,
21. E. J. Ahn et al., Phys. Rev. D 80, 094003 (2009).
044902 (2006).
22. G. Hinshaw et al. (WMAP Collaboration), Astro-
15. S. Ostapchenko, Phys. Rev. D 74, 014026 (2006).
phys. J. Suppl. Ser. 180, 225 (2009).
16. D. Garcia-Gamez et al. (Auger Collaboration), cont-
23. R. Adam et al. (Planck Collaboration), Astron. Ast-
ribution ICRC 2011, arXiv:1107.4807.
rophys. 596, A108 (2016).
17. R. Conceicao, S. Andringa, L. Cazon, and M. Pimen-
24. A. Songaila, Astrophys. J. 561, L153 (2001).
ta (for the Auger Collaboration), EPJ Web Conf. 52,
25. R. Y. Liu, A. M. Taylor, X. Y. Wang, and F. A. Aha-
03004 (2013), arXiv:1301.0507.
ronian, Phys. Rev. D 94,
043008 (2016); arXiv:
1603.03223.
18. L. Collica et al. (Auger Collaboration), Eur. Phys. J.
Plus 131, 301 (2016), arXiv:1609.02498.
26. F. W. Stecker, M. M. Malkan, and S. Scully, Astro-
phys. J. 648, 774 (2006).
19. A. Aab et al. (Auger Collaboration), The Pierre Au-
ger Observatory Upgrade — Preliminary Design Re-
27. R. Aloisio, V. Berezinsky, and P. Blasi, JCAP 10,
port, arXiv:1604.03637.
020 (2014).
68