Лёд и Снег · 2020 · Т. 60 · № 1
УДК 551.32
doi: 10.31857/S2076673420010021
Изменения высоты поверхности и баланс массы
ледникового купола Академии Наук на Северной Земле
© 2020 г. F.J. Navarro1*, P. Sánchez-Gámez1, А.Ф. Глазовский2, C. Recio-Blitz1
1Высшая техническая школа инженеров телекоммуникаций Мадридского политехнического университета, Мадрид, Испания;
2Институт географии РАН, Москва, Россия
*francisco.navarro@upm.es
Surface-elevation changes and mass balance
of the Academy of Sciences Ice Cap, Severnaya Zemlya
F.J. Navarro1*, P. Sánchez-Gámez1, A.F. Glazovsky2, C. Recio-Blitz1
1ETSI de Telecomunicación, Universidad Politécnica de Madrid; 2Institute of Geography, Russian Academy of Sciences, Moscow, Russia
*francisco.navarro@upm.es
Received November 5, 2019 / Revised November 20, 2019 / Accepted December 13, 2019
Keywords: Arctic, glacier mass balance, ice cap, ice surface-elevation change, Severnaya Zemlya.
Summary
We have determined the surface-elevation change rates of the Academy of Sciences Ice Cap, Severnaya Zemlya,
Russian Arctic, for two different periods: 2004-2016 and 2012/2013-2016. The former was calculated from differ-
encing of ICESat and ArcticDEM digital elevation models, while the latter was obtained by differencing two sets
of ArcticDEM digital elevation models. From these surface-elevation change rates we obtained the geodetic mass
balance, which was nearly identical for both periods, at -1,72±0,67 Gt a-1, equivalent to -0,31±0,12 m w.e. a-1
over the whole ice cap area. Using an independent estimate of frontal ablation for 2016-2017 of -1,93±0,12 Gt a-1
(-0,31±0,12 m w.e. a-1), we get an estimate of the climatic mass balance not significantly different from zero,
at 0,21±0,68 Gt a-1 (0,04±0,13 m w.e. a-1), which agrees with the near-zero average balance at a decadal scale
observed during the last four decades. Making an observationally-based assumption on accumulation rate, we
estimate the current total ablation from the ice cap, and its partitioning between frontal ablation, dominated by
calving (~54%) and climatic mass balance, mostly surface ablation (~46%).
Citation: Navarro F.J., Sánchez-Gámez Р., Glazovsky A.F., Recio-Blitz C. Surface-elevation changes and mass balance of the Academy of Science Ice Cap,
Severnaya Zemlya. Led i Sneg. Ice and Snow. 2020. 60 (1): 29-41. [In Russian]. doi: 10.31857/S2076673420010021.
Поступила 5 ноября 2019 г. / После доработки 20 ноября 2019 г. / Принята к печати 13 декабря 2019 г.
Ключевые слова: Арктика, баланс массы ледника, изменения высоты ледниковой поверхности, ледниковый купол, Северная Земля.
На основе разновременных ЦМР установлены скорости изменения высоты поверхности ледни-
кового купола Академии Наук на Северной Земле за два периода: 2004-2016 и 2012/2013-2016 гг.
и определён геодезический баланс его массы (-1,72±0,67 Гт/год). Сделан расчёт климатиче-
ского баланса массы (0,21±0,68 Гт/год) и полной абляции (-3,18 Гт/год) ледника, где на отёл прихо-
дится ≈54%, а на поверхностную абляцию - ≈46%.
Introduction
the mass losses from the Russian Arctic to the end of
the 21st century have been projected to increase con
The Russian Arctic, which is made up of the ar
siderably [5], with an expected contribution to sea-
chipelagos of Novaya Zemlya, Severnaya Zemlya
level rise varying between 9.5±4.6 and 18.1±5.5 mm
and Franz Josef Land, had a total glacierized area of
in sea-level equivalent over 2010-2100, depending on
51 592 km2 in 2000-2010 [1] and an estimated total
the emission scenario [6]. Hence the interest of an ac
ice volume of 16 839±2205 km3 [2]. In spite of cur
curate knowledge of the current mass losses from the
rent regional climate warming [3], the recent ice-mass
Russian Arctic. There are, however, substantial dif
losses from the Russian Arctic have been moderate,
ferences among the various estimates of current mass
at ~11±4 Gt a-1 over 2003-2009 [4], which is much
losses, not only among those obtained using different
lower than other Arctic regions such as the Canadian
techniques, such as ICESat altimetry versus GRACE
Arctic, the Greenland periphery or Alaska, even when
gravimetry, but also among those obtained using a
specific (per unit area) losses are considered. However,
common technique. For instance, Moholdt et al. [7]
29
Ледники и ледниковые покровы
found mass changes of -9.8±1.9 Gt a-1 using ICESat
briefly outline the main previous studies on regional
data and -7.1±5.5 Gt a-1 using GRACE data, both
mass balance available in the literature.
for the same period October 2003 - October 2009.
The climate of Severnaya Zemlya can be consid
The spread among the GRACE estimates is also rather
ered as a polar desert with both low temperatures and
large. For instance, mass changes of -4.6±5.4 Gt a-1
low precipitation [7]. The atmospheric circulation is
have been found for April 2003 - March 2011 [7], of
dominated by high-pressure areas over Siberia and the
-5±3 Gt a-1 for January 2003 - December 2010 [8],
Arctic Ocean, and low pressure over the Barents and
of -15.4±11.9 Gt a-1 for February 2004 - Janu
Kara seas [20, 21]. There is a south-north gradient in
ary 2008 [9], and of -6.9±7.4 Gt a-1 for February
precipitation, with the Kara Sea as a probable moisture
2004 - January 2012 [9]. These differences among
source [21, 22]. This precipitation gradient is demon
the GRACE estimates can be attributed to the non-
strated by the decrease of the ELA in Severnaya Zem
overlapping study periods, to GRACE’s large footprint
lya, as we move from south to north, from ~600 m for
(~250 km), and to uncertainties in the glacier-isostat
the Vavilov Ice Cap, ~400 m for the Academy of Sci
ic adjustment correction, which is known to be poorly
ences Ice Cap and ~200 m for Schmidt Island [16, 23].
constrained in this region [10].
There are two permanent weather stations in the
Since most of the recent ice-mass losses in the Rus
region, Golomyanny and Fedorova (Fig. 1, a of [19]),
sian Arctic have occurred in Novaya Zemlya (~80%),
providing meteorological records from the 1930s to
while only the the remaining ~20% correspond to
the present [20, 24]. The mean annual surface air
Severnaya Zemlya and Franz Josef Land [7], most re
temperatures recorded at these stations are of -14.7
cent studies have focused on Novaya Zemlya. A par
and -15 °C, respectively, with Fedorova register
ticular aim has been to determine the main drivers (cli
ing a mean July temperature of 1.5 °C for the period
mate, glacier dynamics) of the large ice-mass losses
1930-1990 [24]. Mean annual precipitation is also
from Novaya Zemlya [7, 11, 12]. Recent work has re
similar for both weather stations, at ~0.19 m w.e. for
vealed that the retreat rates of the marine-terminating
Golomyanny and ~0.20 m w.e. for Fedorova [20, 24].
outlet glaciers of Novaya Zemlya’s may have slowed
However, Zhao et al. [22] showed that NCEP-NCAR
down [13]. The study of the mass balance of Severna
reanalysis summer temperatures at free air 850 hPa
ya Zemlya glaciers [14-16] or Franz Josef Land [17]
geopotential height over Severnaya Zemlya [25] have
has received comparatively lower attention by the west
weak correlations with the summer mean tempera
ern literature. This motivated our work in a previous
tures measured at Golomyanny Island station. They
paper [18], which had a wider scope, dealing with the
noted that this station is located within the Severna
short-term and long-term variations of ice-surface ve
ya Zemlya archipelago 130 km away from the ice cap
locity, and associated ice discharge variations, the stress
to the southwest into the Kara Sea, at only 7 m a.s.l.,
regime, the surface-elevation changes and their asso
and is strongly influenced by the ocean environ
ciated mass-balance changes. In the present paper, we
ment due to sea-ice melting in summer. Addition
expand the discussion by Sánchez-Gámez et al. [18],
ally, Opel et al. [26] found no correspondence be
focusing on the surface-elevation changes and the geo
tween the number of melt layers in an ice core drilled
detic mass balance of the Academy of Sciences Ice Cap,
at the Academy of Sciences Ice Cap summit and the
and, in particular, on the possible factors controlling its
Golomyanny station summer surface air tempera
long-term changes and trends in climatic mass balance.
tures. On the other hand, Zhao et al. (2014) found
that the total number of melt days on Severnaya Zem
lya was strongly correlated with NCEP-NCAR re
Study site
analysis summer temperatures. For these reasons, we
have not used in our analysis the temperature data
General data for the Academy of Sciences Ice
from Golomyanny and Fedorova stations, but, in
Cap has been presented in the companion paper [19],
stead, the NCEP-NCAR reanalysis temperatures.
so we will not repeat it here. We will focus here on
Neither the precipitation data at Golomyanny and
presenting the climatic conditions of Severnaya
Fedorova stations are representative of the conditions
Zemlya, and the Academy of Sciences Ice Cap in
at the ice cap, which receives a higher amount of pre
particular, as these are most relevant for mass bal
cipitation of ~0,4 m w.e. a-1 [21] than the amount re
ance, which is the focus of this paper. We will also
corded at Golomyanny and Fedorova stations.
30
F.J. Navarro et al.
An automatic weather station installed close to the
very accurate (~15 cm) where gently sloping topogra
summit of Academy of Sciences Ice Cap between May
phy is present [34]. Most observations used in our study
1999 and May 2000 provided temperature information
correspond to spring 2004 (see further details in [18]).
for the air and the shallow snow [27]. The mean an
We also used the ArcticDEM derived from high-reso
nual air temperature was -15.7 °C, whereas the average
lution submetre satellite imagery from the WorldView
temperature of the uppermost 10 m of snow/firn was
and GeoEye satellite constellations [35]. The surface
warmer at -10.2 °C, because of the latent heat released
heights retrieved from this imagery are adjusted using
by the refreezing of percolating surface meltwater. Dur
ICESat-derived altimetry as a reference [36, 37]. Ice-
ing the summer months of July and August tempera
free land surrounding the ice cap served to vertically ad
tures were commonly above the freezing point, causing
just the strips, and as a reference to check the quality of
snowmelt and a decrease in snow height [27].
the DEMs. The horizontal resolution of the strip DEM
Regarding longer-term past temperature evolu
product is 2 m, whereas that of the mosaic DEM prod
tion, an ice core drilled at the summit of the Acad
uct is 10 m. The vertical accuracy of these datasets de
emy of Sciences Ice Cap has provided a temperature
pends on the use of ground-control points as a final step
record for the last 275 years, inferred from δ18O con
for DEM vertical position refinement. When no ground
centrations in the ice core. This record shows a mini
control is available, the DEM accuracy relies on the ac
mum in 1790 followed by an increasing overall trend
curacy of the sensor’s rational polynomial coefficients,
up to present but with a double maximum in the first
and is typically in the order of 4 m [36, 37]. The DEM
half of the 20th century [28, 29]. This increasing tem
strips used for this study correspond to the years 2012,
perature trend helps explaining the role of the Kara
2013 and 2016 (see further details in [18]).
Sea as a moisture source in the area [26, 22]. It also
Ice-surface elevation change rates and associated
explains the increase in sea-salt content at low alti
mass changes. We estimated decadal-scale average sur
tudes on the ice cap, especially during warm sum
face-elevation change rates for 2004-2016 by differenc
mers [29]. The increase in moisture in the region has
ing ICESat altimetry data form 2004 and ArcticDEM
also been influenced by the decreasing trend of sea-
strips from 2016. We also calculated short-term eleva
ice cover in the Arctic beginning in the 1980s [30].
tion changes using pairs of ArcticDEM strip products
The overall picture of temperature change in the last
from 2012/2013-2016. The elevation change rates were
decades is especially critical for the Arctic region,
split into 25-m height bins using an ice-cap hypsom
with a tipping point at the beginning of the 1980s [31].
etry calculated from the ArcticDEM mosaic product.
The mass balance of the ice caps on Severnaya
Mean elevation change rate values were calculated for
Zemlya and their response to climate change has been
individual drainage basins and for increments of ice-
addressed by a set of papers by Bassford et al. [14-16].
cap hypsometry. Volume change rates were converted
For the Academy of Sciences Ice Cap in particular,
to mass loss rates (geodetic mass balance) using an ice
Moholdt et al. [32], using ICESat altimetry togeth
density of 900 kg m-3. This assumes Sorge’s law [38],
er with older DEMs and velocities from Landsat im
i.e. that there is no changing firn thickness or density
agery, calculated the geodetic mass balance and the
through time and that all volume changes are of glacier
calving flux for various periods during the last three
ice. Two error sources were considered: the error de
decades, showing that variable ice-stream dynamics
rived from the differencing of the two datasets and, for
dominated the mass balance of the ice cap.
calculations involving ICESat data, the extrapolation
error associated to an estimation made in an area out
side of the region covered by the ICESat altimetry data.
Data and methods
The error of the elevation difference was calculated as
the square root of the sum of the squares of the mea
Ice-surface elevation data. We used surface-eleva
surement errors of the two elevation sources involved.
tion data from various sources and periods to derive
Dividing this error by the number of years between the
surface-elevation change rates and volume changes.
acquisitions considered provided the elevation change
In particular, we used ICESat elevation data from ver
rate error. The extrapolation error was estimated from
sion 34 of the GLAH06 altimetry product [33], based
the difference, within the same height bins, of the cal
on acquisitions by the Geoscience Laser Altimeter Sys
culated point-wise elevation change rates from ICESat
tem (GLAS) onboard ICESat [34]. ICESat altimetry is
altimetry and the mean elevation change rate from the
31
Ледники и ледниковые покровы
Table 1. Mean annual surface-elevation and mass-change rates for the main marine-terminating drainage basins of the Acade-
my of Sciences Ice Cap. Mass-change rates are calculated assuming an ice density of 900 kg m-3.
Values were calculated from both ICESat-ArcticDEM and ArcticDEM-ArcticDEM differencing, which represent decadal (2004-
2016) and recent, shorter-term (2012/13-2016) average values, respectively. ICESat elevation changes were extrapolated hypsomet
rically. The rates for some basins during 2012/13-2016 are not given because of insufficient coverage of the WorldView images
(which are the basis for the ArcticDEM) in 2012/13
Таблица 1. Среднегодовые значения скоростей изменения высот поверхности и массы для основных ледосборных бас-
сейнов купола Академии Наук, заканчивающихся в море. Скорости изменения массы рассчитаны исходя из плотно-
сти льда 900 кг/м3.
Значения были рассчитаны по разностям ЦМР ICESat-ArcticDEM и ArcticDEM-ArcticDEM. Эти разности характеризу
ют средние изменения соответственно за более чем десятилетний период (2004-2016 гг.) и более короткий современный
период (2012/13-2016 гг.). Изменения высот ICESat экстраполировались гипсометрически. Скорости изменения высот
для некоторых бассейнов в 2012/13-2016 гг. не приведены из-за недостаточной обеспеченности космическими снимка
ми WorldView (которые служат основой для ArcticDEM) для 2012/13 г.
Surface-elevation change rate
Mass-change rate
Drainage basin
ICESat-ArcDEM
ArcDEM-ArcDEM
ICESat-ArcDEM
ArcDEM-ArcDEM
2004-2016, m a-1
2012/13-2016, m a-1
2004-2016, Gt a-1
2012/13-2016, Gt a-1
North
-0,05±0,10
-
-0,05±0,12
-
West
0,06±0,07
-
0,05±0,06
-
A
-0,10±0,10
-0,12±0,11
-0,06±0,07
-0,07±0,07
B
-0,28±0,11
-0,58±0,18
-0,10±0,04
-0,21±0,08
South
-0,20±0,13
-
-0,02±0,01
-
BC
-1,31±0,33
-1,21±0,24
-0,33±0,08
-0,30±0,06
Southeast
-0,14±0,08
-
-0,05±0,03
-
C
-1,00±0,14
-0,95±0,26
-0,75±0,11
-0,71±0,17
D
-1,02±0,13
-0,84±0,21
-0,44±0,06
-0,36±0,10
WorldView strip DEMs. In the case of the short-term
total mass balance into climatic mass balance and fron
changes in surface elevation, which were calculated by
tal ablation. The latter term refers to the ice mass losses
differencing pairs of ArcticDEM strips, the errors in el
by calving, subaerial frontal melting and sublimation,
evation change rate were estimated by comparing two
and subaqueous frontal melting at the nearly-vertical
ArcticDEMs on ice-free land. This analysis provided an
calving fronts [39]. Subaerial frontal melting and subli
RMSE value of 0,91 m for the height differences. Final
mation can be neglected in comparison with the other
ly, the errors for the basin-wide mass change rates were
terms. Submarine melting is assumed to be small for the
calculated using error propagation.
Academy of Sciences Ice Cap, because no substantial
Climatic mass balance. Neglecting basal melt
retreat has been observed along the ice fronts of its near
ing or freezing, the mass-balance rate
for a given
ly-stagnant parts [32]. Consequently, in our case study
basin is calculated as
total frontal ablation can be considered nearly equiva
lent to calving flux or to ice discharge.
M· = B
· + D
· = ∫ b
·dS + ∫ d
·dp,
(1)
S
p
where is the climatic mass-balance rate (surface mass
balance plus internal balance) and is the calving flux,
Results
calculated as a surface integral of its local value , over
the area S of the glacier basin, and a line integral of the
Surface-elevation changes and associated mass
local value
, along the perimeter P of its marine-ter
changes. The calculated surface-elevation change
minating margin, respectively [39]. The calving flux
rates, together with their associated mass change
term is always negative, as it represents a rate of mass
rates (geodetic mass balance) are shown in Table 1
loss. If we know the calving flux (given in the compan
and Figs. 1-3. The surface-elevation changes, at a
ion paper [19]) and the mass-balance rate derived from
decadal scale during 2004-2016, and at a shorter-
the surface-elevation changes (calculated in this paper),
term scale during 2012/2013-2016, are similar, ex
then we can use Equation 1 to estimate the climatic
cept for Basin B. The thinning rate for Basin B during
mass balance for each basin and thus the partitioning of
the most recent period is double than that of the first
32
F.J. Navarro et al.
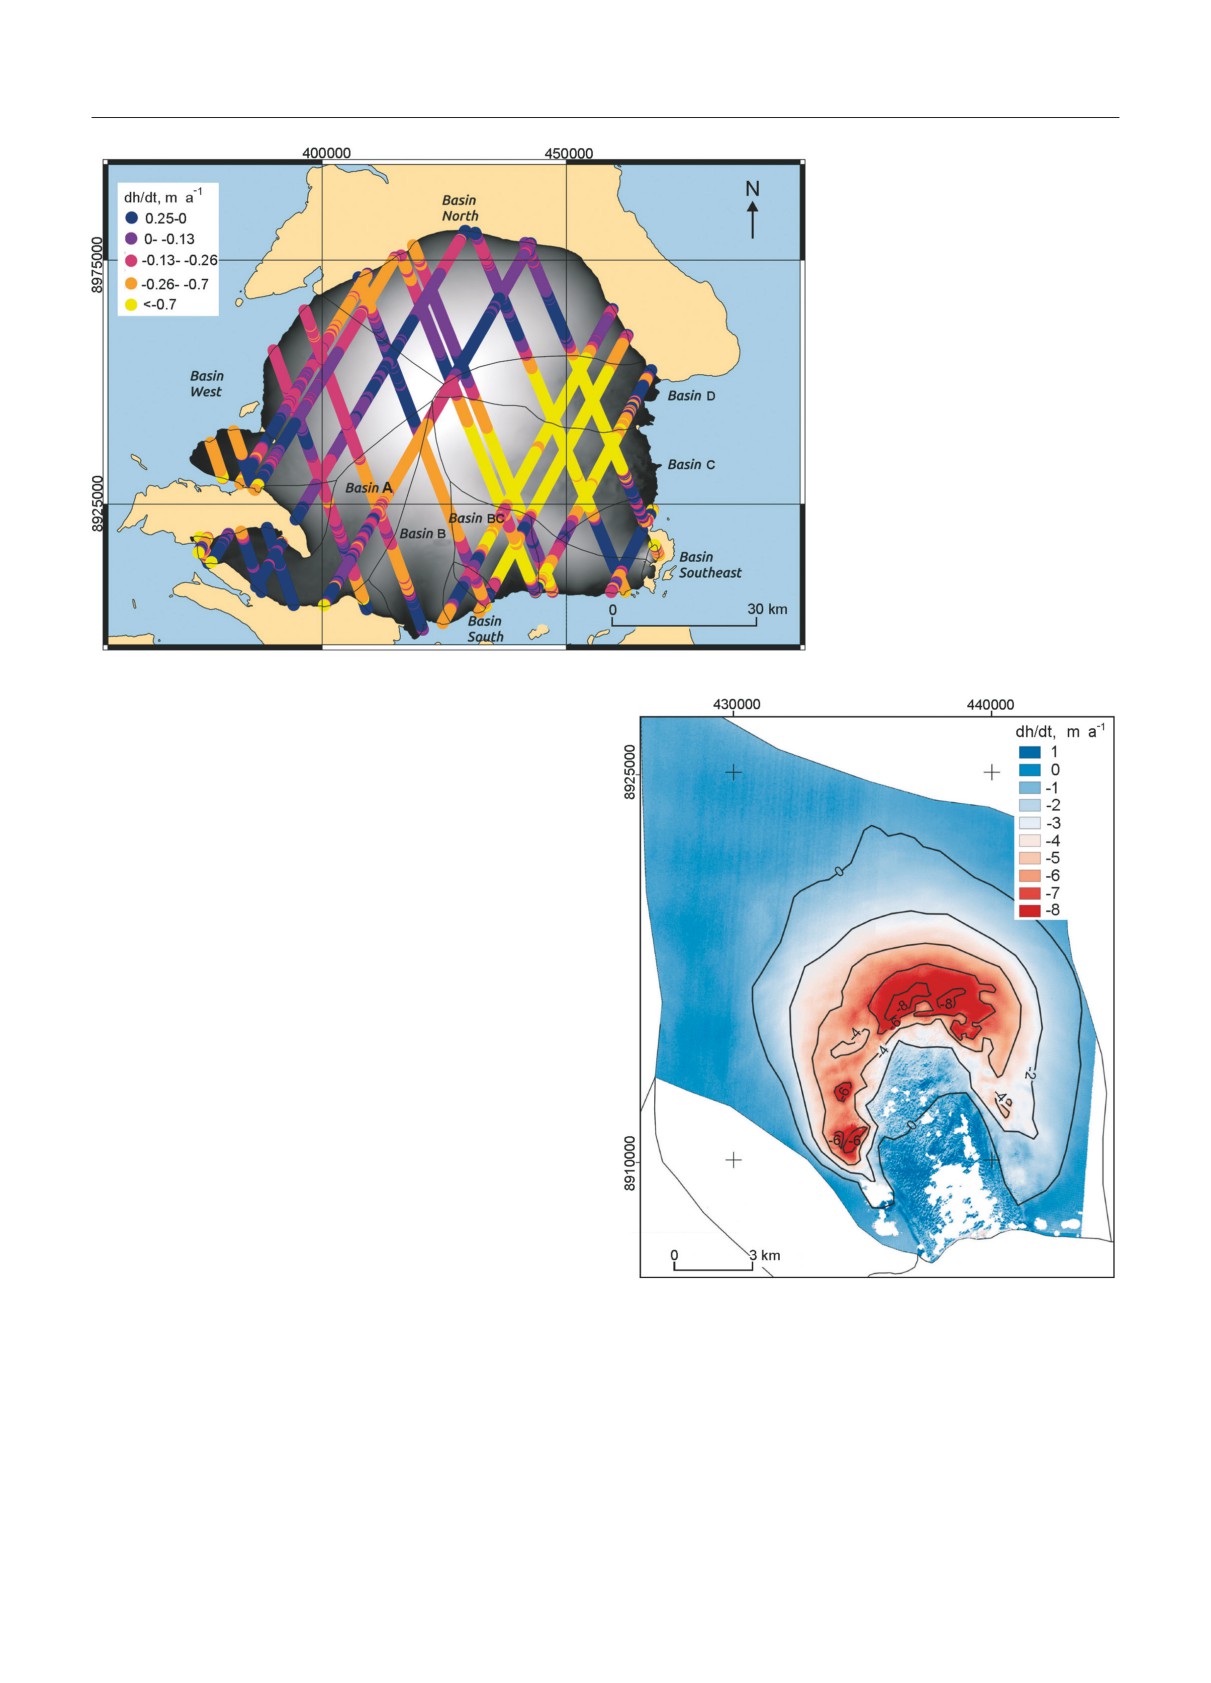
Fig. 1. Surface-elevation change
rates 2004-2016 for the Acade
my of Sciences Ice Cap derived
from ICESat-ArcticDEM differ
encing.
The background image of the ice cap
is the ArcticDEM mosaic product
Рис. 1. Темпы изменения вы
сот поверхности в 2004-2016 гг.
ледникового купола Академии
Наук, полученные на основе
разности данных ICESat-Arctic
DEM.
Фоновое изображение леднико
вого купола представляет собой
мозаику ArcticDEM
period. The decadal-scale surface-elevation change-
rate map displayed in Fig. 1 shows a general thinning
pattern for all marine-terminating basins and a state
close to balance for the land-terminating northern and
marine-terminating western drainage basins. Com
paring Fig. 1 with the surface velocity field in Fig. 2
of the companion paper [19], we note that the thin
ning is largest for the basins with ice streams drain
ing to the southeast and east (Basins BC, C and D).
Drainage Basin A, which has the slowest ice-stream
flow, shows only limited average thinning, though with
greater thinning in its upper part and thickening at
lower elevations. The thinning pattern is similar for all
fast-flowing basins. The highest thinning rates occur
where flow converges from the accumulation areas at
the heads of the major ice streams (see Figs. 2 and 3).
Mass balance. As discussed in the Methods section,
we calculated the climatic mass balance from the total
mass balance and the calving flux using Equation 1.
The total mass balance was obtained from surface-el
evation changes using the geodetic method. As we are
interested in the current climatic mass-balance, we took
the geodetic mass balance for the period 2012/13-2016.
Fig.
2. Surface-elevation change rates of Drainage Basin
However, no geodetic mass-balance data were avail
BC for 2012/13-2016, derived from ArcticDEM-Arctic
DEM strip differencing.
able for certain basins (North, West, South, South
White represents no data
east) because of the lack of coverage by WorldView
Рис. 2. Темпы изменения высот поверхности ледо-
images. For these basins, we took the geodetic mass
сборного бассейна BC за 2012/13-2016 гг., получен
balance for the period 2004-2016. We assume that
ные на основе вычисления разности ArcticDEM-
this does not imply a significant difference, because
ArcticDEM.
the changes in surface-elevation change rates between
Белым цветом показаны участки, где данные отсутствуют
33
Ледники и ледниковые покровы
Fig. 3. Surface elevation change rates 2012/13-2016 for basins B (a), D (b) and C (c), derived from ArcticDEM-Arc
ticDEM strip differencing.
White represents no data
Рис. 3. Темпы изменения высот поверхности в 2012/13-2016 гг. для ледосборных бассейнов B (a), D (b)
и C (c), полученные на основе вычисления разности ArcticDEM-ArcticDEM.
Белым цветом показаны участки, где данные отсутствуют
both periods were very small, almost negligible, for the
negligible, except for Basin B. Therefore, we focus
drainage basins with WorldView coverage in both pe
here on analysing, at a basin scale, the main chang
riods. The results for the geodetic mass balance, with
es in thinning rates between the two periods stud
detail by basin, are shown in Table 2. For the whole
ied by Moholdt et al. [32] (1988-2006 and 2003-
ice cap, we obtained a total geodetic mass balance
2009) and our own results. Note that our study
-1.72±0.67 Gt a-1 (-0.31±0.12 m w.e. a-1). Since
period 2004-2016 partly overlaps with one of the pe
the calving flux calculated in the companion paper [19]
riods (2003-2009) analysed by Moholdt et al. [32].
is
-1.93±0.12 Gt a-1 (-0.35±0.02 m w.e. a-1),
When comparing Moholdt’s data with our own data,
we get a climatic mass balance
0.21±0.68 Gt a-1
it is important to be aware that our Basins North
(0.04±0.13 m w.e. a-1), not significantly different from
and West are grouped together as ‘North’ in Moho
zero. The total mass balance of the ice cap is therefore
ldt et al. [32] study, while our basins South, BC and
dominated by the calving flux.
Southeast are grouped as ‘Others’ in their study.
The basins North (land-terminating) and West
(marine-terminating, but with slow flow), have re
Discussion
mained fairly stable along the whole set of peri
ods analysed by Moholdt et al. [32] and ourselves.
Evolution of the surface-elevation change rates dur-
Basin A presents in 2004-2016 thinning at its upper
ing recent decades. As mentioned in the results sec
part and thickening at lower elevations, as it did dur
tion, the changes in thinning rate between our study
ing both periods analysed by Moholdt et al. [32],
periods (2004-2016 and 2012/13-2016) have been
who indicated a surge-like elevation change pattern,
34
F.J. Navarro et al.
Table 2. Partition of the total mass balance (calculated by the geodetic method) into climatic mass balance and frontal ablation
for the drainage basins of the Academy of Sciences Ice Cap.
The geodetic mass balance has been derived from ArcticDEM-ArcticDEM differencing for 2012/13-2016, except for the basins
marked with an asterisk, for which ICESat-ArcticDEM differencing for 2004-2016 has been used. The frontal ablation data corre
spond to the period November 2016 - November 2017 (see the companion paper [19])
Таблица 2. Разбиение общего баланса массы (рассчитанного геодезическим методом) на климатический баланс массы
и фронтальную абляцию для ледосборных бассейнов ледникового купола Академии Наук.
Геодезический баланс массы получен на основе разности ArcticDEM-ArcticDEM за 2012/13-2016 гг., за исключением
бассейнов, отмеченных звёздочкой, для которых использовалась разность ICESat-ArcticDEM за 2004-2016 гг. Данные по
фронтальной абляции соответствуют периоду ноябрь 2016 - ноябрь 2017 (см. сопутствующую статью [19])
·
·
·
M
B
D
Drainage Basin
Gt a-1
m w.e. a-1
Gt a-1
m w.e. a-1
Gt a-1
m w.e. a-1
North*
-0,05
-0,04
-0,05
-0,04
0
0
West*
0,05
0,05
0,11
0,11
-0,06
-0,06
A
-0,07
-0,11
-0,04
-0,04
-0,03
-0,06
B
-0,21
-0,52
-0,03
-0,07
-0,18
-0,44
South*
-0,02
-0,18
0,02
0,23
-0,04
-0,46
BC
-0,3
-1,09
0,11
0,4
-0,41
-1,49
Southeast*
-0,05
-0,13
0,03
0,08
-0,08
-0,21
C
-0,71
-0,86
-0,02
-0,02
-0,69
-0,83
D
-0,36
-0,76
0,08
0,17
-0,44
-0,93
Ice cap total
-1,72
-0,31
0,21
0,04
-1,93
-0,35
in agreement with the surface velocity fields of the
riod, of -2.56±0.26 m a-1 on average in 1988-2006,
1995 InSAR data of Dowdeswell et al. [23]. Moholdt
compared with ca. -1 m a-1 in the two most recent
et al. [32] also noted a decrease in ice flow, and cor
periods (see Fig. 3, b and Table 3, the latter in terms
respondingly in dynamic instability, between 1988-
of mass balance). Basin D has also shown widespread
2006 and 2003-2009, indicating glacier deceleration.
thinning in all periods, but with a slowly decreasing
Our own data suggest continued deceleration during
trend, which is an indication of sustained fast flow and
the period 2004-2016, with differences in surface-
results in large cumulative thinning (see Fig. 3, c).
elevation change rates between the upper and lower
Overall, we observe a larger dynamic thinning and a
parts greater than 0.8 m a-1 (see Fig. 1).
larger contribution to mass loss by the marine-terminat
The surface-elevation change rate in Basin B de
ing southern and eastern drainage basins for 2004-2016
creased, from -1.26±0.31 m a-1 in 1988-2006, to
and for 2012/13-2016, in comparison with the results
-0.28±0.11 in 2004-2016 and to -0.58±0.18 m a-1 in
of Moholdt et al. [32] for 2003-2006. This largest thin
2012/13-2016. The structure of its spatial changes (see
ning, most relevant at the zones of onset of ice-stream
Figs. 1 and 3, a) is of special interest, because it shows
flow, is an indication of dynamic instability.
a surge-like pattern, with current marked thinning in
Evolution of the mass-balance rates during recent de-
the upper part of the basin (ca. -2 m a-1) and thick
cades. The estimates of the total mass balance of the
ening in the lower part of the ice stream (ca. 1 m a-1).
Academy of Sciences Ice Cap during the last three de
Basins South, BC and Southeast showed a transi
cades, with detail by basin, are shown in Table 3. All
tion from a near-balance value of -0.02±0.10 m a-1 in
mass balances were obtained by the geodetic meth
2003-2006 to thinning in 2004-2016 (surface-eleva
od, which has the limitations derived from the use of
tion change rate of -0.59±0.17 m a-1). This transition
Sorge’s law. Possible changes in the area of the ice
is more marked if Basin BC is considered separately, as
cap, if significant, would involve a further limitation.
its surface-elevation change rate is of -1.31±0.33 m a-1
Dowdeswell et al. [23] reported an ice-cap area of
for 2004-2016, due to the initiation of ice stream flow
5575 km2, based on Landsat images from 1988. Mo
in this basin sometime between 2002 and 2016, as dis
holdt et al. [32], analysing multitemporal satellite im
cussed in the companion paper [19].
agery from Corona and Landsat satellites acquired be
Basin C presented widespread thinning during all
tween 1962 and 2010, concluded that there have been
periods, but with largest changes during the earliest pe no clear trends in the fluctuations of terminus posi
35
Ледники и ледниковые покровы
Table 3. Mass balance rates (geodetic mass balance) for the main drainage basins of the Academy of Sciences Ice Cap and over
different periods.
Basin «North» here groups our basins North and West, and «Others» groups our basins South, BC and Southeast. These names are
used for compatibility with Moholdt et al. [32]. The values used for computing the Ice Cap total in this study are marked with an as
terisk, i.e. we have taken the values for 2012/13-2016 and, when unavailable, those for 2004-2016. All values are given in m w.e. a-1
except those in the last row, given in Gt a-1
Таблица 3. Значения баланса массы (геодезический баланс массы) для основных ледосборных бассейнов ледникового
купола Академии Наук и разных периодов.
Здесь бассейн «North» включает в себя наши бассейны North и West, а бассейн «Others» - наши бассейны South, BC и
Southeast. Эти названия были использованы для возможности сравнения с данными Мохолдта с соавторами [32]. Значе
ния, используемые для вычисления общей величины Ice Cap total в данном исследовании, отмечены звёздочкой, т.е. мы
взяли значения за 2012/13-2016 гг. и, если они отсутствуют, за 2004-2016 гг. Все значения даны в метрах водного экви
валента в год, за исключением значений в последней строке, приведённых в Гт/год
This study
Moholdt et al. [32]
Drainage Basin
ICESat-ArcDEM
ArcDEM-ArcDEM
1988-2006 m w.e. a-1
2003-2009 m w.e. a-1
2004-2016 m w.e. a-1
2012/13-2016 m w.e. a-1
Basin North
0,03±0,18
0,07±0,06
0±0,08*
-
A
0,14±0,23
0,14±0,09
-0,09±0,09
-0,11±0,10*
B
-1,13±0,28
-0,23±0,12
-0,25±0,10
-0,52±0,16*
C
-2,30±0,23
-0,86±0,09
-0,90±0,13
-0,86±0,23*
D
-1,57±0,26
-1,11±0,11
-0,92±0,12
-0,76±0,19*
Others
-0,29±0,23
-0,02±0,09
-0,53±0,15*
-
Ice Cap total
-0,55±0,16
-0,19±0,05
-0,31±0,12
Ice Cap total
-3,06±0,89 Gt a-1
-1,06±0,28 Gt a-1
-1,72±0,67 Gt a-1
tions of the various basins of the Academy of Scienc
(2016/17 vs. 2012/13-2016); 2) the mass balances
es Ice Cap. They calculated a total area loss of the ma
given for certain basins for 2012/13-2016 actually
rine-terminating glaciers of 5 km2 during 1988-2009,
correspond to 2004-2016, due to unavailability of
including several cases of small local advance and re
WordView images for those basins in 2012/13-2016.
treat. The corresponding rate of ice-volume loss was of
Taken together, the results in Table 2 of [19] and
only 0.02 km3 a-1, which is insignificant in terms of ice-
Table 3 of this paper indicate that the total mass bal
cap mass balance. Our own observations, using Land
ance of the ice cap is nearly equivalent to the calving
sat-7 and Sentinel-2 optical images from July 2002 and
losses, which means that the long-term climatic mass
March 2016, respectively, showed local advances and
balance has remained close to zero since 1988.
retreats of the eastern and southern marine margins of
The scarce earlier observations of climatic mass
up to ca. 1-2 km with respect to the margins of Moho
balance available for the Vavilov Ice Cap on October
ldt et al. [32], but the net change in area was negligible
Revolution Island, some 120 km to the south of the
and thus we used their same ice-cap area of 5570 km2.
Academy of Sciences Ice Cap, also indicate a near-
The total mass balances shown in Table 3 are
zero average balance of -0.03 m a-1 for the periods
similar, although with reversed sign, to those of
1975-1981 and 1986-1988 [40]. Mass-balance mod
the calving fluxes presented in Table 2 of the com
elling experiments by Bassford et al. [14], also for the
panion paper [19]. The largest difference (ca.
Vavilov Ice Cap, give a similar value of -0.02 m a-1
0.3-0.4 Gt a-1, for 2003-2009), is attributed to the
for the whole period 1974-1988. Although all of these
use by Moholdt et al. [32] of Basin North as an ana
estimates suggested a large interannual variability,
logue for the climatic mass balance of the whole ice
such year-to-year variations have limited interest in
cap (the slightly positive climatic mass balance of
the context of this discussion, as we only have avail
Basin North multiplied by the area of the whole ice
able average mass-balance estimates over periods of
cap accounts for this difference). The second larg
several years, up to more than a decade. Therefore, me
est difference corresponds to the most recent peri
may conclude that the climatic mass balance of the
od, and it could be attributed to two facts: 1) the pe
Academy of Sciences Ice Cap has remained close to
riods analysed in both tables are close but not equal
zero on average for the last four decades.
36
F.J. Navarro et al.
Possible factors controlling long-term changes and
analysis of the deep ice core drilled at the ice-cap
trends in climatic mass balance. Thinking of possi
summit in 1999-2001. Deuterium excess (the dif
ble controlling factors, summer air temperature
ference between the two stable water-isotope ratios
and precipitation seem the most evident to analyse.
δ18O and δD) in precipitation depends mainly on
Using NCEP-NCAR and ERA-Interim reanalysis
the evaporation conditions in the moisture-source
data for Novaya Zemlya and Severnaya Zemlya from
region, and to a lesser extent on the condensation
1995-2011, Zhao et al. [22] studied the influence of
temperatures. The main factors controlling the pro
summer (June-September) mean 850 hPa geopoten
cess are the relative air humidity and the sea-surface
tial height temperature on snowmelt. They analysed
temperature (SST) and, to a lesser degree, the wind
the trends of both total melt days (TMD) and melt
speed during evaporation. Based on the relationship
offset date (MOD). For Severnaya Zemlya, the tem
between deuterium excess and SST, Opel et al. [26]
perature trends during 1995-2011 were of 0.80 °C de
observed that in hemispherically warmer periods the
cade-1 (NCEP-NCAR, p-value < 0.05) and
Academy of Sciences Ice Cap receives more pre
0.88 °C decade-1 (ERA-Interim, p-value = 0.065).
cipitation from moisture evaporated at lower SSTs,
Zhao et al. [22] found a positive correlation between
for example due to a northward shift of the mois
mean TMD and the average June-September NCEP-
ture source. Since most precipitation on Severnaya
NCAR air temperature at 850 hPa, with the slope
Zemlya is brought by air masses moving from the
of the linear regression of 10 days °C-1 (r = 0.843,
south and southwest, the Kara Sea is likely to be a
p-value < 0.0001). Using simple regression, they also
regional moisture source and its sea-ice cover would
found that the TMDs of Severnaya Zemlya are signif
be the main factor influencing summer and autumn
icantly anti-correlated to the Laptev Sea (r = -0.735,
evaporation. Lower sea-ice cover in the Kara Sea
p-value < 0.001) and Kara Sea (r = -0.678, p-val
would allow higher evaporation rates and enhance
ue < 0.003) September sea-ice extent. However, since
the contribution of regional moisture to precipita
sea-ice extent and glacier surface melting can co-re
tion over the Academy of Sciences Ice Cap. Moho
spond to the regional temperature increase, Zhao
ldt et al. [32] searched for some evidence of this pre
et al. [22] used additionally partial correlation analy
cipitation increase for Novaya Zemlya and Severnaya
sis to remove the large-scale influence of air tempera
Zemlya, finding a slightly higher precipitation rate in
ture on both variables. Upon removal of these effects,
2004-2009 with respect to the mean for 1980-2009,
partial correlation analysis suggested that glacier melt
especially for Novaya Zemlya. For Severnaya Zem
on Severnaya Zemlya was still statistically anti-cor
lya, its climatic mass balance close to zero suggests
related to the Laptev Sea and Kara Sea sea-ice ex
that the recent precipitation anomaly is also likely to
tent. An explanation can be that reduced offshore
be real, as it provides the most reasonable mecha
sea-ice concentration, i.e. increased open-water frac
nism to counterbalance the observed increasing melt
tion, can enhance onshore advection of sensible and
trend. In summary, the near-equilibrium climatic
latent heat fluxes [41]. However, even if long-term
mass balance of the Academy of Sciences Ice Cap
changes in summer (and annual) temperatures have
(and most generally of Servernaya Zemlya) is prob
been observed during our analysed period [18], and
ably the result of two opposing effects. On one hand,
regional sea-ice concentration has also shown a clear
sea-ice cover loss would enhance precipitation by
decreasing trend [18], these changes seem to have ex
exposing larger areas of open water to evaporation.
erted only a minor impact on the long-term climatic
On the other, these larger areas of open water would
mass balance estimates for the Academy of Sciences
allow onshore advection of heat fluxes from warm
Ice Cap, which remain close to zero. An explanation
ing mixed ocean layers, accelerating surface melt on
suggested by Zhao et al. [22] is that sea-ice reduction
the ice cap. With the climatic mass balance remain
exposes larger areas of open water in summer to evap
ing near zero, the role of the calving flux is critical in
oration and change the large-scale atmospheric circu
determining the total mass balance of the Academy
lation, which results in increased summer precipita
of Sciences Ice Cap.
tion over the Arctic [42, 43].
Total ablation and its partitioning between fron-
For the Academy of Sciences Ice Cap, the in
tal ablation and surface ablation. For the projections
fluence of sea-ice concentration on precipitation
of future contributions of glacier wastage to sea-lev
has been observed by Opel et al. [26], through their
el rise, it is of interest to know the relative contribu
37
Ледники и ледниковые покровы
tions of surface ablation and frontal ablation to the
0.46 m w.e. a-1 [28], frontal ablation would have rep
total ablation. Frontal ablation is equivalent, in our
resented ~42% of the total ablation over the period
case study, to calving flux, which has been calculat
2012-2016, with the remaining ~58% corresponding
ed in the companion paper [19]. But we also need an
to surface ablation. We conclude that calving loss
estimate of surface ablation. To get it, we subtracted
es are a substantial component, in fact about half of
from our calculated climatic mass balance for 2012-
the total mass loss from the Academy of Sciences Ice
2016 (0.21±0.68 Gt a-1; see section ‘Results’) an es
Cap. This value is higher than a previous estimate by
timate of the total accumulation over the ice cap.
Dowdeswell et al. [23] for the Academy of Scienc
This estimate of accumulation was based on the mea
es Ice Cap in 1995, of ~40%. It is also higher than
sured net accumulation at the ice-cap summit and
the available estimates for other large Arctic ice caps
its variation with altitude, as done by Dowdeswell
such as Austfonna, for which Dowdeswell et al. [49]
et al. [23], and is described below.
estimated that calving accounted for 30-40% of total
At the summit of the Academy of Sciences Ice
ablation, or Svalbard as a whole, for which Błaszczyk
Cap, analysis of an ice core detected the layers of
et al. [50] gave an estimate of 17-25%.
maximum radioactivity (in terms of Cesium137) corre
sponding to the 1963 atmospheric nuclear tests and to
the 1986 Chernobyl event. The resulting average net
Conclusions
accumulation rates were 0.45 m w.e. a-1 from 1963
to 1999, and 0.53 m w.e. a-1 from 1986 to 1999 [44].
Our analysis leads to the following main conclu
Later analyses by Fritzsche et al. [28] gave an average
sions:
accumulation rate of 0.46 m w.e. a-1 over 1956-1999
1. The average total geodetic mass balance of the
based on stable-isotope investigations. These values
ice cap during 2012-2016 was of -1.72±0.27 Gt a-1,
are also in agreement with the mean annual net mass
which is equivalent to -0.31±0.05 m w.e. a-1 over the
balance of 0.43-0.44 w.e. a-1 observed by Zagoro
entire ice cap area.
dnov [45] for 1986/87 using structural-stratigraphic
2. The average climatic mass balance of the
methods, although in disagreement with the annu
ice cap during 2012-2016 (similar to that for 2004-
al-layer thickness of 0.26-0.28 m suggested by Kle-
2016), was not significantly different from zero, at
mentyev et al. [46] and used by Kotlyakov et al. [47]
0.21±0,68 Gt a-1, or equivalently 0.04±0.13 m w.e. a-1.
for dating the Academy of Sciences ice core drilled
This agrees with the scarce in-situ observations in the
in 1986/87. On the other hand, measurements else
region during the 1970s and 1980s, and with remote-
where in Severnaya Zemlya suggest that annual pre
sensing estimates by other authors for 1988-2006 and
cipitation decreases with altitude from 0.45 at the ice-
2003-2009. The average climatic mass balance has thus
cap summit to 0.25 m w.e. a-1 close to sea level [48].
remained around zero during the last four decades.
Assuming, a value of 0.30 m w.e. a-1 as average ac
3. Our estimated average total ablation (surface ab
cumulation rate over the entire ice cap, as done by
lation plus frontal ablation) over the period 2012-2016
Dowdeswell et al. [23], we obtained a total accumula
is of -3.18 Gt a-1, of which frontal ablation (dominat
tion of 1.67 Gt a-1. If, instead, we had used as ice-cap
ed by calving) accounts for ~54% and the remaining
averaged accumulation rate its upper bound, given by
~46% corresponds to surface ablation. Calving losses
the net accumulation rate at the ice cap summit of
are, therefore, an important contributor to the mass
0.46 m w.e. a-1 [28], the total accumulation over the
losses from the Academy of Sciences Ice Cap.
ice cap would have been of 2.56 Gt a-1.
4. Since the climatic mass balance has remained
Since our estimate of climatic mass-balance is
close to zero over the last four decades, in spite of re
of 0.21 Gt a-1, the surface ablation will thus be of
gional warming, the total mass balance of the ice cap
-1.46 Gt a-1. If we add the frontal ablation (most
has been driven mainly by calving.
ly calving) of -1.72 Gt a-1, we get a total ablation of
-3.18 Gt a-1. This implies that iceberg calving rep
Acknowledgments. This study has received funding
resents, on average, ~54% of the mass losses over
from the European Union’s Horizon 2020 research
2012-2016, with the remaining 46% correspond
and innovation programme under grant agreement
ing to surface ablation. If we had considered, in
No 727890 and from Agencia Estatal de Investig
stead, the upper bound for the accumulation rate of
ación under grant CTM2017-84441-R of the Spanish
38
F.J. Navarro et al.
Estate Plan for R & D. Support to AG by the Russian
5570 км2. Используя независимую оценку фрон
Fund for Basic Research grant 18-05-60109 is also
тальной абляции за 2016-2017 гг., которая равна
acknowledged. DEMs were provided by the Polar
-1,93±0,12 Гт/год (-0,31±0,12 м вод. экв./ год),
Geospatial Center under NSF OPP awards 1043681,
получаем оценку климатического баланса массы
1559691 and 1542736.
ледникового купола, существенно не отлича
ющуюся от нуля и равную 0,21±0,68 Гт / год
(0,04±0,13 м вод. экв./год), что вполне согласу
Расширенный реферат
ется с почти нулевым средним балансом, наблю
давшимся в течение последних четырёх десяти
Определены скорости изменения высоты по
летий. Обсуждаются также возможные факторы,
верхности ледникового купола Академии Наук
которые управляют долгосрочными изменени
на о. Комсомолец (архипелаг Северная Земля в
ями и трендами климатического баланса массы,
Российской Арктике) за два периода: 2004-2016
включая температуру, осадки, сплочённость мор
и 2012/13-2016 гг. Скорости для первого пери
ских льдов, относительную влажность воздуха,
ода рассчитаны на основе разности цифровых
температуру поверхности моря и скорость ветра.
моделей высот ICESat и ArcticDEM, а для вто
Используя данные об аккумуляции, измеренной
рого периода - на основе разности двух набо
на вершине ледникового купола, и высотный гра
ров цифровых моделей высот ArcticDEM. Ис
диент аккумуляции накопления, оцениваются
ходя из этих скоростей изменения высоты
полная аккумуляция и, следовательно, полная
поверхности и предполагая, что плотность льда
абляция ледникового купола как -3,18 Гт / год.
равна 900±17 кг/м3, оценён геодезический баланс
Далее рассчитывается, в какой пропорции пол
массы купола, который был почти одинаков для
ная абляция распределяется между фронтальной
обоих периодов и составил -1,72±0,67 Гт/год, что
абляцией, в которой преобладает отёл (≈54%), и
эквивалентно потерям -0,31±0,12 м вод. экв./год
климатическим балансом массы, в основном по
на всей площади ледникового покрова, равной
верхностной абляцией (≈46%).
References
tenberg S., Bolch T., Sharp M., Ove Hagen J., van den
Broeke M., Paul F. A reconciled estimate of glacier
1. Pfeffer W., Anthony A., Bliss A., Bolch T., Cogley G., Gard-
contributions to sea level rise: 2003 to 2009. Science.
ner A., Ove Hagen J., Hock R., Kaser G., Kienholz C.,
2013, 340: 852-857. doi: 10.1126/science.1234532.
Miles E., Moholdt G., Mölg N., Paul F., Radić V., Rast-
5. Radić V., Bliss A., Beedlow C., Hock R., Miles E., Cog-
ner P., Raup B., Rich J., Sharp M., The Randolph Con-
ley G. Regional and global projections of twenty-first
sortium. The Randolph Glacier Inventory: a globally
century glacier mass changes in response to climate sce
complete inventory of glaciers. Journ. of Glaciology.
narios from global climate models. Climate Dynamics.
2014, 60: 537-552. doi: 10.3189/2014JoG13J176.
2013, 42: 37-58. doi: 10.1007/s00382-013-1719-7.
2. Huss M., Farinotti D. Distributed ice thickness and vol
6. Huss M., Hock R. A new model for global glacier change
ume of all glaciers around the globe. Journ. of Geo
and sea-level rise. Frontiers in Earth Science. 2015, 3:
phys. Research: Earth Surface. 2012, 117: 1-10. doi:
1-22. doi: 10.3389/feart.2015.00054.
10.1029/2012jf002523.
7. Moholdt G., Wouters B., Gardner A. Recent mass
3. Hartmann D., Klein Tank A., Rusticucci M., Alexan-
changes of glaciers in the Russian High Arc
der L., Brönnimann S., Charabi Y., Dentener F., Dlu-
tic. Geophys. Research Letters. 2012, 39: 1-5. doi:
gokencky E., Easterling D., Kaplan A., Soden B.,
10.1029/2012gl051466.
Thorne P., Wild M., Zhai P. Intergovernmental Panel
8. Jacob T., Wahr J., Pfeffer W., Swenson S. Recent contri
on Climate Change 2013. Observations: Atmosphere
butions of glaciers and ice caps to sea level rise. Nature.
and Surface. In: The Physical Science Basis: Working
2012, 482: 514-518. doi: 10.1038/nature10847.
Group I. Contribution to the Fifth Assessment Report
9. Matsuo K., Heki K. Current ice loss in small glacier sys
of the Intergovernmental Panel on Climate Change
tems of the Arctic islands (Iceland, Svalbard, and the
Cambridge University Press, Cambridge, United
Russian High Arctic) from satellite gravimetry. Ter
Kingdom and New York, NY, USA. 2013: 159-254.
restrial Atmospheric and Oceanic Sciences. 2013, 24:
doi: 10.1017/CBO9781107415324.008.
657-670. doi: 10.3319/tao.2013.02.22.01(tibxs).
4. Gardner A., Moholdt G., Cogley J., Wouters B., Arendt A.,
10. Svendsen J., Gataullin V., Mangerud J., Polyak L. The
Wahr J., Berthier E., Hock R., Pfeffer W., Kaser G., Lig-
glacial history of the Barents and Kara sea region. In
39
Ледники и ледниковые покровы
Developments in Quaternary Sciences. Elsevier, 2004:
21. Bolshiyanov D., Makeyev V. Arkhipelag Severnaya Zem-
369-378. doi: 10.1016/s1571-0866(04)80086-1.
lya: Oledeneniye, Istoriya Razvitiya Prirodnoy Sredy.
11. Carr J., Stokes C., Vieli A. Recent retreat of major
Severnaya Zemlya Archipelago: Glaciation and Histor
outlet glaciers on Novaya Zemlya, Russian Arc
ical Development of the Natural Environment. St. Pe
tic, influenced by fjord geometry and sea-ice condi
tersburg: Gidrometeoizdat, 1995: 216 p. [In Russian].
tions. Journ. of Glaciology. 2014, 60: 155-170. doi:
22. Zhao M., Ramage J., Semmens K., Obleitner F. Re
10.3189/2014jog13j122.
cent ice cap snowmelt in Russian High Arctic and
12. Melkonian A., Willis M., Pritchard M., Stewart A. Re
anti-correlation with late summer sea ice extent. En
cent changes in glacier velocities and thinning at No
vironmental Research Letters. 2014, 9: 045009. doi:
vaya Zemlya. Remote Sensing of Environment. 2016,
10.1088/1748-9326/9/4/045009.
174: 244-257. doi: 10.1016/j.rse.2015.11.001.
23. Dowdeswell J., Bassford R., Gorman M., Williams M.,
13. Carr J., Bell H., Killick R., Holt T. Exceptional retreat
Glazovsky A., Macheret Y., Shepherd A., Vasilenko Y.,
of Novaya Zemlya’s marine-terminating outlet gla
Savatyuguin L., Hubberten H., Miller H. Form and flow
ciers between 2000 and 2013. The Cryosphere. 2017, 11:
of the Academy of Sciences Ice Cap, Severnaya Zem
2149-2174. doi: 10.5194/tc-11-2149-2017.
lya, Russian High Arctic. Journ. of Geophys. Research.
14. Bassford R., Siegert M., Dowdeswell J., Oerlemans J.,
2002, 107: 1-16. doi: 10.1029/2000jb000129.
Glazovsky A., Macheret Y. Quantifying the mass balance
24. Dowdeswell J., Ove Hagen J., Björnsson H.,
of Ice Caps on Severnaya Zemlya, Russian high Arctic.
Glazovsky A., Harrison W., Holmlund P., Jania J., Ko-
I: climate and mass balance of the Vavilov Ice Cap. Arc
erner R., Lefauconnier B., Ommanney S., Thomas R.
tic, Antarctic, and Alpine Research. 2006, 38: 1-12. doi:
The mass balance of Circum-Arctic glaciers and recent
10.1657/1523-0430(2006)038[0001:qtmboi]2.0.co;2.
climate change. Quaternary Research. 1997, 48: 1-14.
15. Bassford R., Siegert M., Dowdeswell J. Quantify
doi: 10.1006/qres.1997.1900.
ing the mass balance of Ice Caps on Severnaya Zem
25. Kalnay E. and 21 others. The NCEP/NCAR 40-year
lya, Russian high Arctic. II: modeling the flow of the
reanalysis project. Bulletin of the American Me
Vavilov Ice Cap under the present climate. Arctic,
teorological Society. 1996, 77(3): 437-472. doi:
Antarctic, and Alpine Research. 2006, 38: 13-20. doi:
10.1175/1520-0477(1996)077<0437:TNYRP>2.0.CO;2.
10.1657/1523-0430(2006)038[0013:qtmboi]2.0.co;2.
26. Opel T., Fritzsche D., Meyer H., Schütt R., Weiler K.,
16. Bassford R., Siegert M., Dowdeswell J. Quantifying the
Ruth U., Wilhelms F., Fischer H. 115 year ice-core
mass balance of Ice Caps on Severnaya Zemlya, Rus
data from Akademii Nauk Ice Cap, Severnaya Zem
sian high Arctic. III: sensitivity of Ice Caps in Sever
lya: high-resolution record of Eurasian Arctic climate
naya Zemlya to future climate change. Arctic, Ant
change. Journ. of Glaciology. 2009, 55: 21-31. doi:
arctic, and Alpine Research. 2006, 38: 21-33. doi:
10.3189/002214309788609029.
10.1657/1523-0430(2006)038[0021:qtmboi]2.0.co;2.
27. Kuhn M. Severnaja automatic weather station data
17. Zheng W., Pritchard M., Willis M., Tepes Paul., Gour-
(Severnaja Zemlja). In: The response of Arctic ice
melen N., Benham T., Dowdeswell J. Accelerating gla
mass to climate change (ICEMASS). Third year report
cier mass loss on Franz Josef Land, Russian Arctic.
(January-December 2000). European Commission,
Remote Sensing of Environment. 2018, 211: 357-375.
Framework IV, Environment and Climate Research
doi: 10.1016/j.rse.2018.04.004.
Programme (DG XII), contract ENV4-CT970490.
18. Sánchez-Gámez P., Navarro F., Benham T., Glazovsky A.,
Oslo, University of Oslo. 2000, 7-8-7-14.
Bassford R., Dowdeswell J. Intra- and inter-annual vari
28. Fritzsche D., Schütt R., Meyer H., Miller H., Wil-
ability in dynamic discharge from the Academy of Sci
helms F., Opel T., Savatyugin L. A 275 year ice-core re
ences Ice Cap, Severnaya Zemlya, Russian Arctic, and
cord from Akademii Nauk Ice Cap, Severnaya Zemlya,
its role in modulating mass balance. Journ. of Glaciol
Russian Arctic. Annals of Glaciology. 2005, 42: 361-
ogy. 2019, 65 (253): 780-797. doi: 10.1017/jog.2019.58.
366. doi: 10.3189/172756405781812862.
19. Sánchez-Gámez P., Navarro F.J., Dowdeswell J.A., De
29. Opel T., Fritzsche D., Meyer H. Eurasian Arctic climate
Andrés E. Surface velocities and calving flux of the
over the past millennium as recorded in the Akademii
Academy of Sciences Ice Cap, Severnaya Zemlya.
Nauk ice core (Severnaya Zemlya). Climate of the Past.
Led i Sneg. Ice and Snow. 2020, 60 (1): 19-28. doi:
2013, 9: 2379-2389. doi: 10.5194/cp-9-2379-2013.
10.31857/S2076673420010020
30. Stroeve J., Serreze M., Holland M., Kay J., Malan-
20. Alexandrov E., Radionov V., Svyashchennikov P. Snow
ik J., Barrett A. The Arctic’s rapidly shrinking sea ice
cover thickness and its measurement in Barents and
cover: a research synthesis. Climatic Change. 2011, 110:
Kara seas. In: Research of climate change and interac
1005-1027. doi: 10.1007/s10584-011-0101-1.
tion processes between ocean and atmosphere in polar
31. Hansen J., Ruedy R., Sato M., Lo K. Global surface
regions. Trudy of the Arctic and Antarctic Research In
temperature change. Reviews of Geophysics. 2010, 48:
stitute: St. Petersburg, 2003, 446: 99-118. [In Russian].
RG4004. doi: 10.1029/2010rg000345.
40
F.J. Navarro et al.
32. Moholdt G., Heid T., Benham T., Dowdeswell J. Dy
Materialy Glyatsiologicheskikh Issledovaniy. Data of
namic instability of marine-terminating glacier ba
Glaciological Studies. 1992, 75: 35-41. [In Russian].
sins of Academy of Sciences Ice Cap, Russian High
41. Rennermalm A., Smith L., Stroeve J., Chu V. Does sea
Arctic. Annals of Glaciology. 2012, 53: 193-201. doi:
ice influence Greenland ice sheet surface-melt? En
10.3189/2012aog60a117.
vironmental Research Letters. 2009, 4: 024011. doi:
33. Zwally H.J., Schutz R., Hancock D., Dimarzio J.
10.1088/1748-9326/4/2/024011.
GLAS/ICEsat L2 Global Land Surface Altimetry
42. Serreze M., Barrett A., Stroeve J. Recent changes in
Data (HDF5), Version 34. Boulder, Colorado USA:
tropospheric water vapor over the arctic as assessed
NASA National Snow and Ice Data Center Distributed
from radiosondes and atmospheric reanalyses. Journ.
Active Archive Center. 2014. doi: 10.5067/ICESAT/
of Geophys. Research: Atmospheres. 2012, 117: 1-21.
GLAS/DATA211.
doi: 10.1029/2011jd017421.
34. Zwally H.J., Schutz B., Abdalati W., James A., Bent-
43. Francis J. The where and when of wetter and drier:
ley C., Bernner A., Bufton J., Dezio J., Hancock D.,
disappearing Arctic sea ice plays a role. Environmen
Harding D., Herring T., Minster B., Quinn K., Palm S.,
tal Research Letters. 2013, 8: 1002. doi: 10.1088/1748-
Spinhirne J., Thomas R. ICESat’s laser measurements
9326/8/4/041002.
of polar ice, atmosphere, ocean, and land. Journ. of
44. Fritzsche D., Wilhelms F., Savatyugin L., Pinglot J.,
Geodynamics. 2002, 34: 405-445. doi: 10.1016/s0264-
Meyer H., Hubberten H., Miller H. A new deep ice core
3707(02)00042-x.
from Akademii Nauk Ice Cap, Severnaya Zemlya,
35. Porter C., Morin P., Howat I., Noh M., Bates B., Pe-
Eurasian Arctic: first results. Annals of Glaciology.
terman K., Keesey S., Schlenk M., Gardiner J.,
2002, 35: 25-28. doi: 10.3189/172756402781816645.
Tomko K.,Willis M., Kelleher C., Cloutier M., Husby E.,
45. Zagorodnov V.S., Klementyev O.L., Nikiforov N.N.,
Foga S., Nakamura H., Platson M., Wethington M.,
Nikolaëv V.I., Savatyugin L.M., Sasunkevich V.A. Hy
Williamson C., Bauer G., Enos J., Arnold G., Kram-
drothermal regime and ice formation in the central
er W., Becker P., Doshi A., D'Souza C., Cummens P.,
part of the Akademiya Nauk glacier, Severnaya Zem
Laurier F., Bojesen M. ArcticDEM. Harvard Dataverse,
lya. Materialy Glyatsiologicheskikh Issledovaniy. Data of
V1. 2018. doi: 10.7910/DVN/OHHUKH.
Glaciological Studies. 1990, 70: 36-43. [In Russian].
36. Noh MJ., Howat I. Automated stereo-photogram
46. Klementyev O., Korotkov I., Nikolaev V. Glaciologi
metric DEM generation at high latitudes: surface ex
cal studies on the ice domes of Severnaya Zemlya in
traction with TIN-based search-space minimization
1987-1988. Materialy Glyatsiologicheskikh Issledovaniy.
(SETSM) validation and demonstration over glaciated
Data of Glaciological Studies. 1988, 63: 25-26. [In
regions. GIScience & Remote Sensing. 2015, 52: 198-
Russian].
217. doi: 10.1080/15481603.2015.1008621.
47. Kotlyakov V., Zagorodnov V., Nikolayev V. Drilling on
37. Noh M.J., Howat I., Porter C., Willis M., Morin P. Arctic
ice caps in the Soviet Arctic and on Svalbard and pros
Digital Elevation Models (DEMs) generated by Surface
pects of ice core treatment, in Arctic research: Advanc
Extraction from TIN-Based Search space Minimization
es and prospects. Proc. of the Conference of Arctic and
(SETSM) algorithm from RPCs-based Imagery. AGU
Nordic Countries on Coordination of Research in the
Fall Meeting Abstracts. 2016: EP24C-07.
Arctic. Leningrad, December 1988. 1990, 2: 5-18.
38. Bader H. Sorge’s law of densification of snow on high
48. Bryazgin N.N., Yunak R.I. Air Temperature and Pre
polar glaciers. Journ. of Glaciology. 1954, 2: 319-323.
cipitation on Severnaya Zemlya During Ablation and
doi: 10.3189/s0022143000025144.
Accumulation Periods. In: Geographical and Glacio
39. Cogley, J., Hock R., Rasmussen L., Arendt A., Baud-
logical Studies in Polar Countries. St. Petersburg: Gi
er A., Braithwaite R., Jansson P., Kaser G., Möller M.,
drometeoizdat, 1988: 70-81. [In Russian].
Nicholson L., Zemp M. Glossary of glacier mass bal
49. Dowdeswell J., Benham T., Strozzi T., Hagen J. Iceberg
ance and related terms. IHP-VII Technical Docu
calving flux and mass balance of the Austfonna Ice
ments in Hydrology No. 86, IACS Contribution No. 2,
Cap on Nordaustlandet, Svalbard. Journ. of Geophys.
UNESCO-IHP, Paris, 2011: 114 p. doi: 10.1017/
Research. 2008, 113 (F3). doi: 10.1029/2007jf000905.
S0032247411000805.
50. Błaszczyk M., Jania J., Hagen J. Tidewater glaciers of
40. Barkov N.I. New data on the structure and develop
Svalbard: recent changes and estimates of calving flux
ment of the Vavilov Ice Dome, Severnaya Zemlya.
es. Polish Polar Research. 2009, 30 (2): 85-142.
41