Лёд и Снег · 2020 · Т. 60 · № 2
УДК 551.321
doi: 10.31857/S2076673420020032
Employing X-ray computed tomography for the non-destructive ice cores analysis
© 2020 г. A.G. Khairedinova1,2*, S.S. Kutuzov1, V.N. Mikhalenko1, D.V. Korost2, A.N. Khomyak2
1Institute of Geography, Russian Academy of Sciences, Moscow, Russia; 2Lomonosov Moscow State University, Moscow, Russia
*Khaisasha_@mail.ru
Применение методики компьютерной томографии для неразрушающего
анализа ледниковых кернов
А.Г. Хайрединова1,2*, С.С. Кутузов1, В.Н. Михаленко1, Д.В. Корост2, А.Н. Хомяк2
1Институт географии РАН, Москва, Россия; 2Московский государственный университет имени М.В. Ломоносова, Москва, Россия
*Khaisasha_@mail.ru
Received January 24, 2019 / Revised June 6, 2019 / Accepted September 19, 2019
Keywords: cryothermos, high-resolution density records, ice (glacial) cores, the Caucasus, X-Ray computed tomography.
Summary
Computed t omography (CT) i s a n ondestructive hig h-resolution wa y t o investigate t he t hree-dimensional
structure o f s amples (ice , r ock, et c.). ἀ e r esults o f CT a nalysis o f g lacial co res co nsisting o f firn a nd ice
extracted on the Western plateau of the Elbrus Mountain (5100-5150 m a.s.l.) in the summer of 2017 are pre-
sented in the article. ἀ e core taken from the depth of 20.31-21.87 m and consisting of three sections (aver-
age length is 52 cm each) was analyzed. In order to maintain the natural negative temperature of the glacial
core, a special cryothermos has been created. It conserved the temperature at the level of -25 °C. Data on the
structural features of the s amples and the three-dimensional pattern of the ice-firn density were obtained.
Correlations b etween the density and some chemical elements had been established. ἀ e CT d ata made it
possible also to determine sizes o f ice cr ystals. Comparison of cross sections of cores with firn and ice t hin
sections (30 in t otal) has shown that the crystal structure is best displayed in t he ice in ter-layers since it is
impossible to determine reliably sizes of the firn grains at the given survey resolution. Also, the use of the CT
method made it possible to determine inclination of the firn layers within the ice core, which is caused by the
inheritance of the slope of the surface microrelief and internal inhomogeneities of the firn thickness. Calcula-
tions showed that the angle of inclination of the layers varies from 6 to 9°.
Citation: Khairedinova A.G., Kutuzov S.S., Mikhalenko V.N., Korost D.V., Khomyak A.N. Employing X-ray computed tomography for the non-destructive
ice cores analysis. Led i Sneg. Ice and Snow. 2020. 60 (2): 182-191. doi: 10.31857/S2076673420020032.
Received January 24, 2019 / Revised June 6, 2019 / Accepted September 19, 2019
Ключевые слова: данные плотности высокого разрешения, Кавказ, компьютерная томография, криотермос, ледниковые керны.
Методика компьютерной томографии позволяет получить снимки послойных срезов леднико-
вого керна с помощью рентгеновских лучей. В работе представлен анализ кернов с Западного
плато Эльбруса с помощью компьютерного томографа РКТ-180. Для поддержания естественных
условий керна был создан специальный криотермос, который препятствует таянию образца и
изменению структуры фирна во время съёмки. Исследована внутренняя структура керна, уста-
новлены размеры кристаллов в разных слоях, найдены неоднородности и получена трёхмерная
картина плотности льда.
Introduction
alyzing the ice cores. The presence of drawbacks,
even in most advanced techniques employed over the
An importance of gaining information from high
past decade, leads to attempts to create new analyti
altitude ice cores is constantly increasing due to the
cal methods. For example, the development of the
global warming. In comparison with Greenland and
continuous flow analyses (CFA), automated chemi
Antarctic regions, which have slower response to the
cal method, permitted to pump samples and reagents
climate changes, mountain glaciers are dramatically
continuously through a system of modules intercon
retreating and disappearing. A wide range of methods
nected by tubing [1]. Employing the laser ablation
is available for studying ice cores presently: chemis
mass spectrometry with inductively coupled plas
try, isotopes, trace elements etc. A variety of most
ma (LA-ICP-MS) produced detailed information
advanced modern technologies are employed for an
about isotopic and chemical composition in sam
182
A.G. Khairedinova et al.
ples [2, 3]. The method allows getting ultra-high-
Full-length ice core CT was suggested by Voland
sensitivity chemical analysis at the ppb-level without
et al. [12], however, it required substantial techno
any special preparation of the sample. The problem,
logical support. In the first attempt, the idea was to
however, remains in most of the methods that is re
investigate the structure of ice cores before transpor
lated to the destruction of samples during the analy
tation that lead to applying ice core CT for the first
ses. Ice is essentially lost in the process and become
time in the field (Kohnen station, DML, Antarcti
unavailable for other types of analyses.
ca). Subsequently, a research group from Alfred We
Computed tomography is a well-known tech
gener Institute created a laboratory with X-Ray CT
nique for obtaining cross-sectional images. In the
system inside a freezer room maintained at -25 °C.
last decade, this method has become widely rec
The main goal of our study was to further develop the
ognized and emerged as a leading analytical tool in
methodology for the full-length ice core CT analy
many areas [4, 5]. Computed tomography system al
sis and to evaluate the adequacy of the CT method
lows obtaining a three-dimensional distribution of
for studying ice core stratigraphy. Here we present
the X-ray absorption values in the entire volume of
the first CT results of shallow firn core from Mt. El
the sample within the limits of the resolution. All
brus A CT system enables analyzing ice cores, de
X-ray opaque elements give signal through densi
termine the porosity, compare the visual stratigra
ty and chemical composition differences. The mor
phy and chemistry and to correlate those results to
phology and pore size, caverns, cracks, and in
the ice core thin sections. Since high image qual
clusions are analyzed. The main advantage of the
ity is required to get precise results, a vast amount
method is the non-invasiveness (using intact ice sec
of measurement data was produced. We discuss the
tions) of the samples [6, 7]. Since ice cores are very
advantages and possible further development of CT
precious, the main advantage in using Computed To
analyses for ice core studies.
mography (CT) is that it does not affect further pro
cessing of samples. The analysis cost is relatively low,
while the amount of information obtained is substan
Data and Methods
tial. CT method should be used before other analy
ses. The use of non-destructive CT method does not
The Caucasus mountains are situated between
affect subsequent work with the samples [8].
the Black and the Caspian seas in the south of Rus
Initially, the technique of computed tomography
sia. Ice core drilling took place at Mt. Elbrus, locat
was used in medicine and made a revolution in the
ed in the Central Caucasus Mountains. A shallow
field as it became possible to obtain information about
ice core with a diameter of 9 cm and total length of
the internal structure of the human organism without
24 m was extracted from the Western Elbrus Plateau
surgery. Almost the same equipment and software for
in the summer of 2017. The drilling site was located
interpretation of the X-ray survey can be used for sci
at an elevation of 5115 m [13]. Three sections (an av
entific purposes for sediment or ice core analysis. The
erage length of 52 cm) extracted from the depth of
first attempts to include CT in the principal methods
20,31-21,87 m were used in this study. In order to
of ice core studies were made in 1990 when J.M. Bar
perform the CT analysis for the full-length ice core,
nola and his colleagues used X-Ray tomography for
the freezing temperature had to be maintained during
3D reconstruction of the Vostok firn structure [9].
the imaging session. For this purpose, we used a spe
A related method of micro-tomography is presently
cial cryogenic thermos of 100 mm diameter. It con
in rather high demand [10]. One of its disadvantages
sisted of a polyvinyl chloride pipe with sealed ends
is the necessity of laboratory sampling. The general
and double walls. The antifreeze between the walls
principle of the method is similar to the ordinary CT,
was cooled at -25 °C. The cryothermos may accom
however, micro-CT permits studying the inner struc
modate 1 m long core sections and maintain a suit
ture with high resolution (several microns) [11]. An
able temperature for approximately 5 hours. To test
other problem of working with CT is the necessity of
the ability of the CT system to analyze full length ice
maintaining below-zero temperature. Sneed et al. [2]
cores the artificial ice core (diameter 9 cm, length
tried to solve this problem by constructing a cryocell
30 cm) was made. It contained ice, firn, snow, and
that would permit to do laser ablation inside the cryo
some mineral particles. Artificial core was made by
system while minimizing the sampling area.
sequential adding layers of water, snow and firn sam
183
Ледники и ледниковые покровы
Fig. 1. Computed Tomography system:
a - scheme of the mutual arrangement of the sys
tem elements and the sample in a three-dimension
al coordinate system with the main system parts:
the source of X-rays, the object of study, the detec
tor, fixing the level of radiation absorbed by the ob
ject; b - photo of a CT-180 tomograph located at
the Geological Faculty of Lomonosov Moscow
State University. The main parts of a CT scanner
are: 1 - a protective cabinet; 2 - a core holder; 3 -
a mobile support of an X-ray apparatus; 4 - an
X-ray detector moving along the core; 5 - a PC for
Рис. 1. Система компьютерной томографии:
a - схема взаимоположения элементов систе
мы и образца при съёмке в трёхмерной систе
ме координат с основными узлами: источник
рентгеновских лучей, объект изучения, детек
тор, фиксирующий уровень излучения, погло
щённого объектом; b - фотография компью
терного томографа РКТ-180, расположенного
на геологическом факультете МГУ имени
ные части томографа: 1 - защитный шкаф; 2 -
кернодержатель; 3 - подвижная опора рентге
новского аппарата; 4 - детектор рентгенов
ского излучения, перемещающийся вдоль
керна; 5 - ПК для обработки данных КТ
ples collected earlier on Elbrus glacier into the plastic
ple. The attenuation depends on the density and the
tube. The tube was then frozen (-20 °C). Additional
atomic number of the material from which the object
ly, layers of mineral particles collected in Elbrus were
is composed. When X-Rays pass through a material,
also added. The CT system consists of the X-Ray
the radiation absorption level can be associated with
source, an object of the study and the detector, that
four types of interaction: photoelectric absorption,
determine the level of radiation absorbed by the ob
Compton scattering, the formation of electron-posi
ject (Fig. 1, a) [12].
tron pairs, and coherent Rayleigh scattering. The set
A separate two-dimensional image correspond
of obtained X-ray patterns is then recalculated into a
ing to the intensity of X-Ray radiation after passing
set of density sections that reflect the internal struc
through the sample forms the shadow projection.
ture of the sample. This operation is called recon
The main principle of computed tomography is to
struction. The most common way to display CT den
obtain a set of such projections from different an
sities is to distribute the shades of gray on the graphic
gles. This is usually accomplished by its subsequent
slices formed by the system during reconstruction.
stepwise rotation. In addition to the x-ray projection
Lighter shades correspond to a higher density, and
of the sample, information about the spatial reso
darker colors correspond to a lower density. A com
lution of the object, the source, and the detector is
puted tomograph RCT-180 at the Geological De
recorded in contrast with classical X-Ray radiogra
partment of Lomonosov Moscow State University
phy [4]. The brightness (different gradations of gray)
was employed in this study (see Fig. 1, b).
on the X-Ray shadow projection reflects the attenu
This instrument is used for the study of rocks,
ation of X-Ray radiation, because of the scattering
soils, unconsolidated bottom sediments, biological
and absorption of the signal passed through the sam
samples, etc. It allows scanning cores with a length
184
A.G. Khairedinova et al.
of 1 m and with a diameter of 10 cm. The scanner is
els). Here we also used the results of the chemical
characterized by a 150-250 μm spatial resolution,
and isotopic composition of the Mt. Elbrus ice core.
100 × 100 × 1000 mm active area and 160 kV in
The isotopic composition was measured in Climate
tensity. The stage rotates for full 360°, in 0.3° steps,
and Environmental Research Laboratory, St. Pe
with carriage lift 0.2 mm. For the artificial core, the
tersburg, while major ions were studied in the Insti
following parameters were used: 1.5-5 mA amper
tute for Geosciences and Environmental Research,
age, 160 kV intensity, and 115 μm spatial resolution.
Grenoble, France [14].
For Elbrus ice cores the parameters of computer to
mographer retained the same, except for the spa
tial resolution (230 μm). The average survey time
Results
was approximately 1.5 hours. The data reconstruc
tion was performed using the TomoViewer software,
The test core. The artificial ice core contained
Geologika (Novosibirsk). The data were processed
ice layer, firn and firn with ice lenses to represent
on the Dell Precision T5500 workstation using soft
the variety of the possible structures in real ice cores
ware products: Data Viewer, CTan (calculations and
(Fig. 2). We also added fine mineral particles from a
construction of 3D models of radiopaque compo
snow sample collected previously in snow pit in El
nents) and CTVol (visualization of volumetric mod
brus as well as some coarse particles collected from
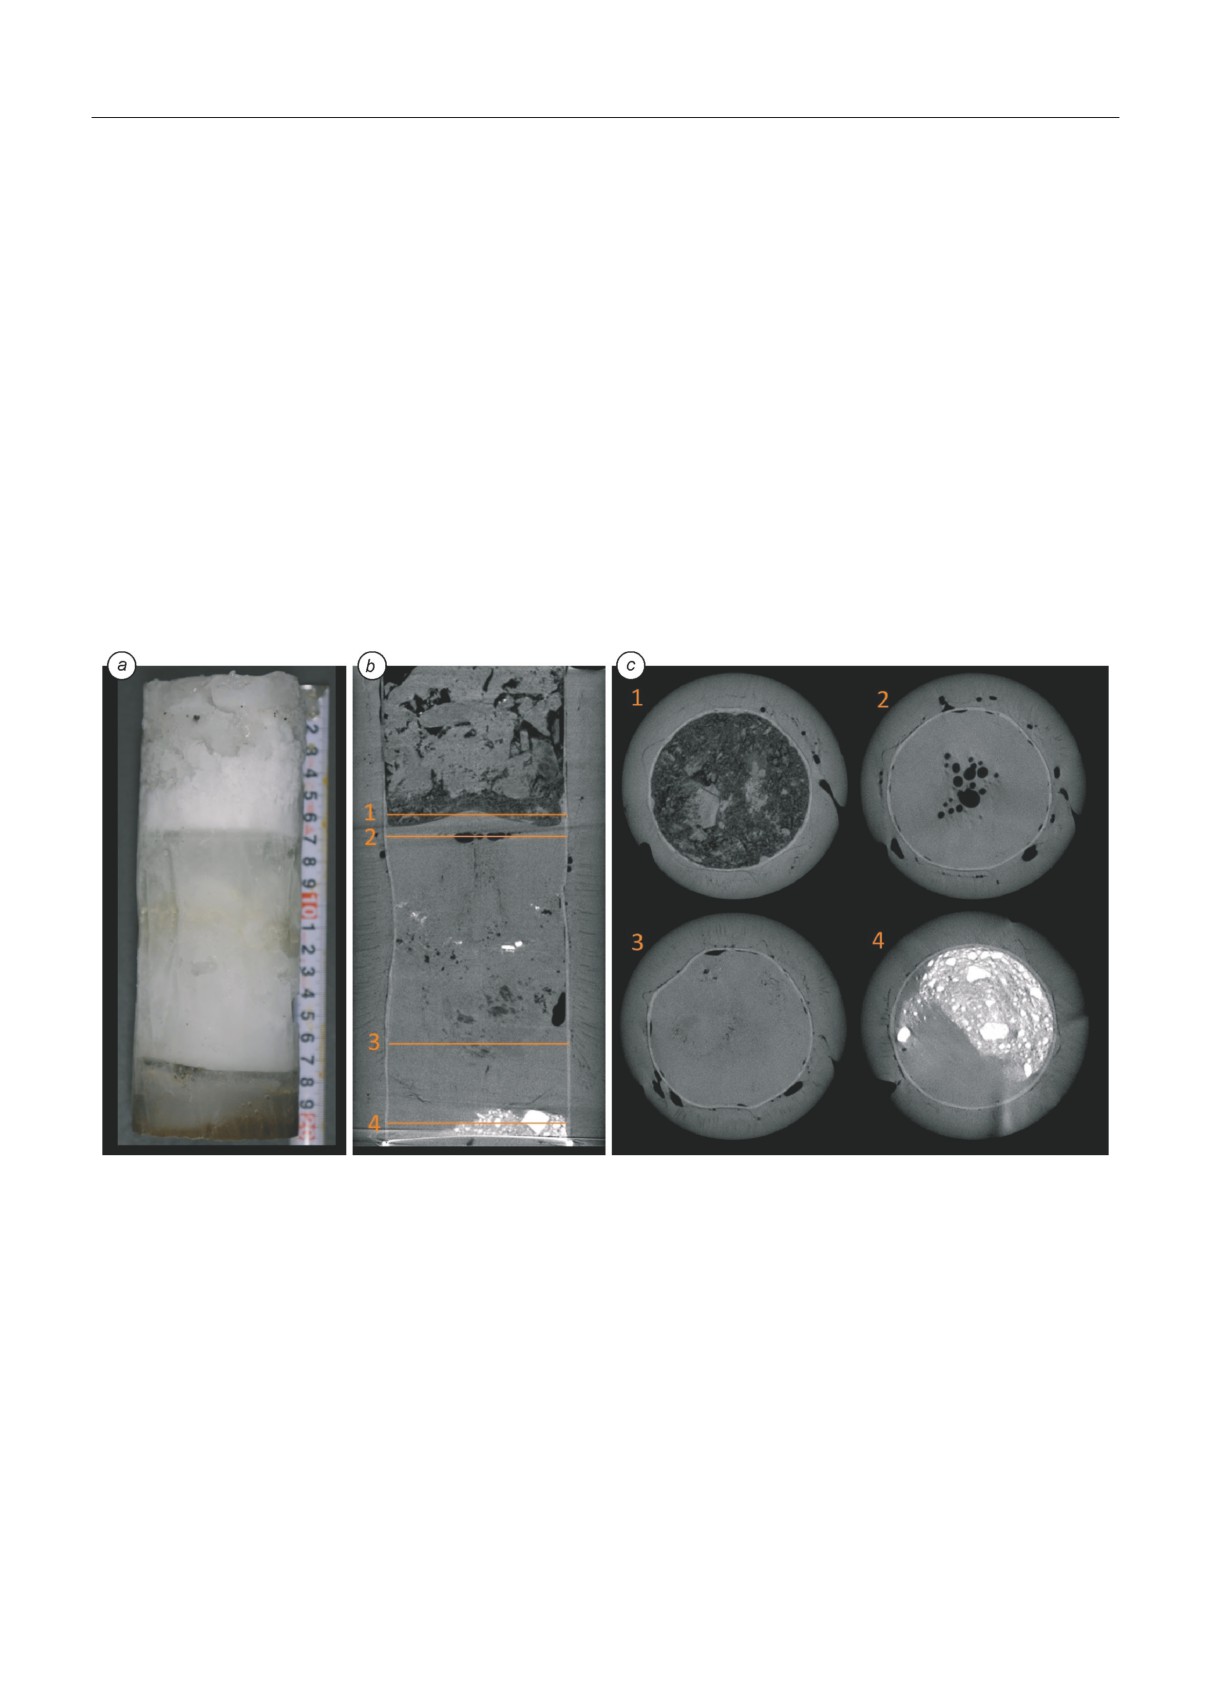
Fig. 2. Artificial ice core:
a - a photo of the ice core with a scale bar (length of the core is 20 cm); b - stereological visualization of a longitudinal section of
the core with its internal structure; brightness (various shades of gray) reflects the difference in absorption; based on this, areas of
ice core with different composition were identified: black color (maximum absorption) - air inclusions, dark gray - firn, gray - ice,
white (minimum absorption) - mineral inclusions; c - ice core cross sections: 1 - core interlayer with firn (dark gray color); 2 -
core interlayer with ice (gray color) and the formation of air bubbles (black color); 3 - core interlayer with ice; 4 - core interlayer
with mineral inclusions (white color) and ice. The orange lines indicate the places of the core cross-sections
Рис. 2. Искусственный керн:
a - фотография керна с масштабной линейкой (длина керна 20 см); b - стереологическая визуализация продольного
среза керна с его внутренним строением; яркость (различные оттенки серого) отражает разницу в поглощающей способ
ности: чёрный цвет (максимальное поглощение) - включения воздуха; тёмно-серый - фирн; серый - лёд; белый цвет
(минимальное поглощение) - минеральные включения; c - поперечные срезы керна: 1 - прослой керна, вмещающий
фирн (тёмно-серый цвет); 2 - прослой керна, состоящий из льда (серый цвет) с образованием пузырьков воздуха (чёр
ный цвет); 3 - прослой керна, состоящий изо льда; 4 - прослой керна с минеральными включениями (белый цвет) и
льдом. Оранжевые линии соответствуют поперечным срезам керна
185
Ледники и ледниковые покровы
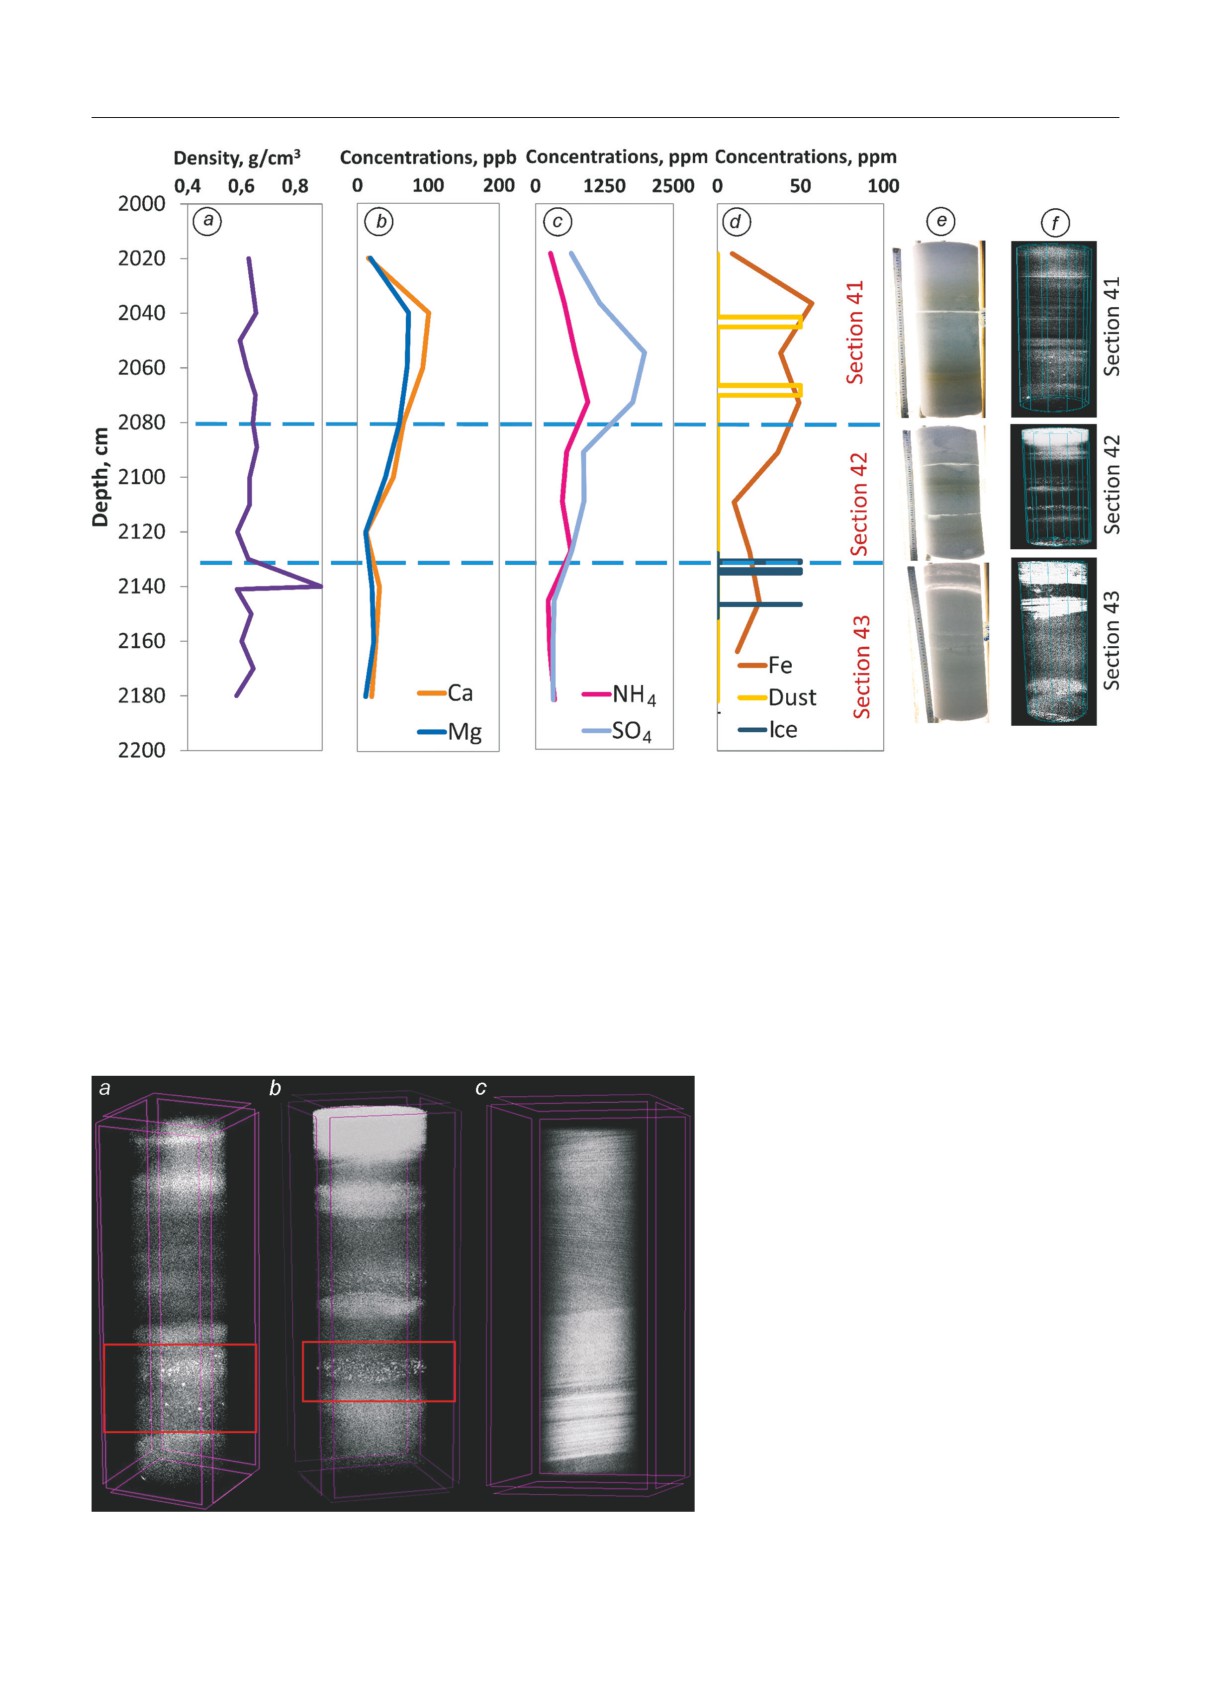
the rock outcrops near the drilling site. Fig. 2, b
for Mg. The ion concentrations level off in sec
shows the stereological visualization of the artificial
tion 43. This distribution is due to the presence of a
ice core. Main structure heterogeneities were detect
large amount of dust in ice in the section 41. A dou
ed. The brightness (different gradations of gray) on
ble peak of calcium, corresponding to two dust lay
the X-ray shadow projection reflects the attenuation
ers in the ice core is observed also in Fe profile (sec
of X-ray radiation, due to the effects of scattering
tion 41). When considering the dependence of the
and absorption of the signal passed through the sam
presence of chemical inclusions on optical density, it
ple. The cross sections with contrasting media are
was revealed that the high concentration of Ca indi
shown, namely mineral inclusions, ice, firn and air
cated the dust layer that can be identified by CT.
bubbles (see Fig. 2). The optical density corresponds
In Fig. 4 separate dense horizons are observed,
to the degree of of Х-rays attenuation of transpar
which are reflected in the variations of chemical ele
ent objects or reflection of light by an opaque object.
ments. Pronounced in density is only the dust layer
Optical density can be calculated using the formula
in which concentrations of all chemical elements are
OD = log10 (I0 /I), i.e. I0 - incident optical intensity,
rising. However, this may be due to the sampling
I - transmitted optical intensity. The types of objects
technique in 10-cm increments, which could cause
with the highest values of optical density (270 and
the chemical signal to be blurred or not manifested
more) are the dense mineral inclusions. The average
at all. The section shown in the red frame in Fig. 4, a
value of the optical density for ice in an artificial core
and b has the highest density values. When compared
is 120-150. The optical density of air approaches 0.
with the gradations of the artificial core, it was sug
Considering the results of artificial ice core, the inner
gested that the formations may be separate mineral
structure heterogeneities in the natural ice cores can
dust particles. It is possible that individual dust par
be detected using the same approach.
ticles in the ice core can be observed using the CT
Shallow core-2017. The Elbrus shallow firn
technique. The problem that arises when interpreting
core was dated using well preserved seasonal sta
data is the separation of noise and the signal from the
ble isotopic oscillations. The seasonal amplitude of
actual crystals. For their separation, it is necessary
δ18O change was 25.2 ‰, with average values being
to create criteria for the selection of density classes.
-25 ‰ in winter and -10 ‰ in summer respective
Under low resolution imaging conditions, it is often
ly. The ice core covers the period of 2012-2017 with
difficult to find an increase in the density reflected in
mean annual accumulation rate of 2200 mm w.e.
CT images corresponding to an increase in the con
Three sections used in CT analyses correspond to the
centration of inclusions. These shortcomings should
layers accumulated during the warm season of 2012.
be considered in future studies.
A detailed description of section’s stratigraphy was
Another important advantage of this technique is
made in the cold laboratory. It was revealed that the
the ability to trace the inclination of the layers in three
cores are composed mostly of firn and contain min
dimensions (see Fig. 4, c), since usually information
eral particles. Ice layers and dust horizons can be
about the 3D structure of the ice layers is not avail
visually identified. The distribution profiles of the
able. It is possible to clearly trace the firn layers and
main chemical elements are presented in Fig. 3 to
calculate their angle of inclination relative to the bore
gether with density characteristics of the core. The
hole. The firn core from the depth of 2020-2180 cm
density was measured in cold laboratory using dis
is composed of firn and the inclination, in this case,
crete sections for every 10 cm. The maximum density
is due to the influence of the surface microrelief and
of 0.8 g/cm2 was observed for the layers at the edge of
possible internal inhomogeneities. The calculations
sections 42 and 43. The distribution profiles of Ca2+,
showed, that the angle of inclination of the layers in
Mg+, NH4+, SO42-, and Fe2+ were analyzed to find
the studied sections varies from 6 to 9°. With further
similar patterns.
use of the CT technique for deeper core sections such
The values for all ions were elevated in section 41:
information may provide insights into basal ice flow
for Ca the maximum value is 100 ppb, for Mg -
disturbances. Such information is important to verify
80 ppb, for NH4 - 800 ppm, for SO4 - 1850 ppm,
the ice flow and depth age modelling.
for Fe - 60 ppm. Concentrations decreased in
Structural features. The method of computed to
section 42: NH4 = 400 ppm, SO4 = 600 ppm,
mography allows determining the internal structure
Fe = 25 ppm, and the minimum are equal to 10 ppb
of the core. According to the obtained CT data, it
186
A.G. Khairedinova et al.
Fig. 3. The distribution profiles of the density, chemical elements, CT data and visual images in three sections of ice
cores (sections 41-43) from the depth 20,31-21,87 m.
Dashed blue lines indicate the boundaries between core sections. The distribution profile: a - density measured in freezer condi
tions every 10 cm: b - Ca and Mg; c - NH4 and SO4; d - Fe, horizons of mineral dust and ice interlayers; e - photographs of sec
tions with visible layers of dust and ice horizons; f - stereological visualization of sections with identified internal heterogeneity
Рис. 3. Графики плотности, химических элементов, КТ-данных и фотографии ледниковых кернов в трёх
секциях керна (секции 41-43) c глубины 20,31-21,87 м.
Пунктирные голубые линии - границы между секциями кернов. Профили распределения: а - плотности, измеренной в
условиях морозильной камеры через каждые 10 см: b - Ca и Mg; c - NH4 и SO4; d - Fe, горизонтов минеральной пыли и
прослоев льда; e - фотографии секций керна с видимыми прослоями пыли и ледяных горизонтов; f - стереологическая
визуализация секций с выявленной внутренней неоднородностью
Fig. 4. Stereological visualization of ice cores:
a - lower part of section 41; b - section 43 with dif
ferent absorption of horizons; in the red rectangles -
presumably mineral dust particles; c - upper part of
section 41 with visible slope of the firn layers
Рис. 4. Стереологическая визуализация лед
никовых кернов:
а - нижняя часть секции керна 41; b - сек
ция 43 с различными по абсорбционной спо
собности горизонтами; в красных прямоуголь
никах - предположительно минеральная пыль;
с - верхняя часть секции 41 с видимым накло
ном слоёв фирна
187
Ледники и ледниковые покровы
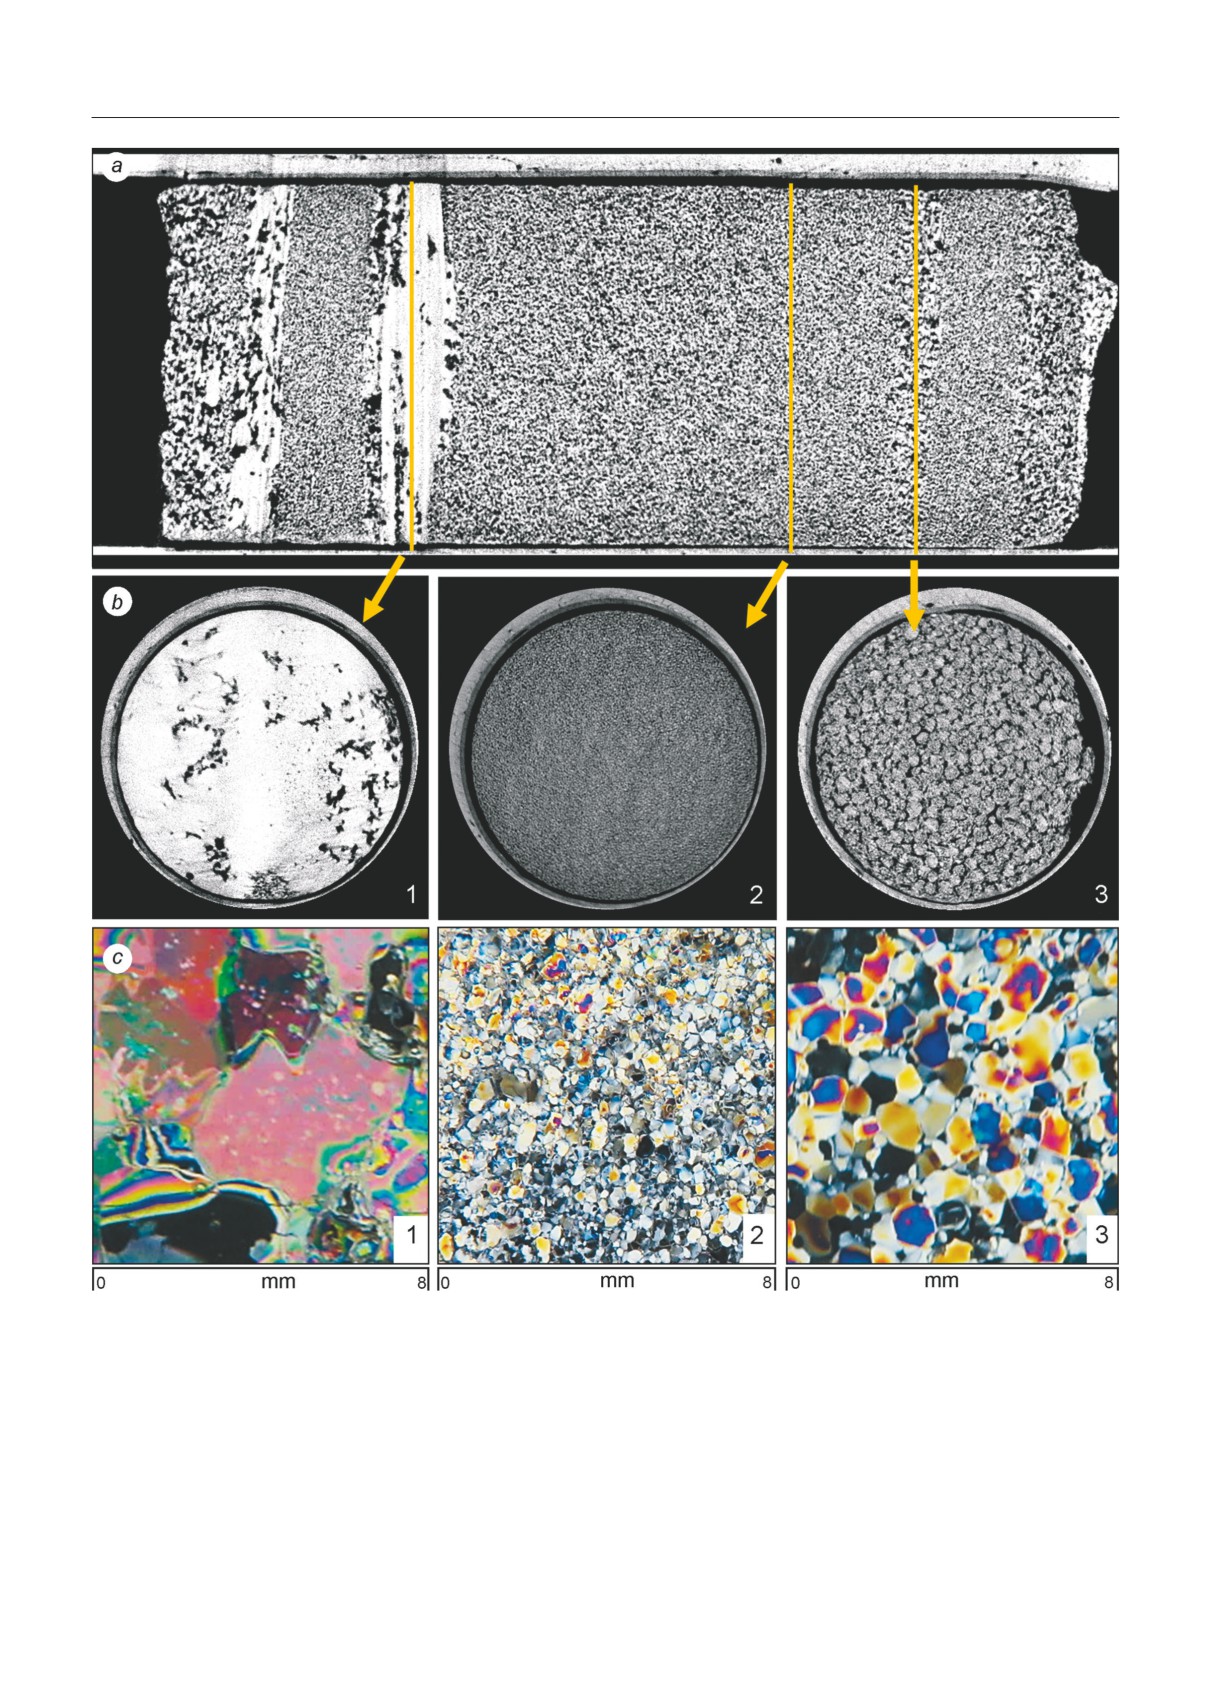
Fig. 5. The inner structure of the ice core:
a - stereological visualization of the section 43; yellow lines with arrows indicate the cross sections; b - cross-sections of the core:
1 - ice (white color); 2 - fine-grain firn (dark gray color); 3 - coarse-grain firn (gray color); c - thin sections from the same hori
zons with crystals of: 1 - ice; 2 - fine-grain firn; 3 - coarse-graine firn
Рис. 5. Внутренняя структура ледникового керна:
а - стереологическая визуализация секции 43; жёлтые линии соответствуют поперечным срезам керна; b - поперечные
срезы керна: 1 - лёд (белый цвет); 2 - мелкозернистый фирн (тёмно-серый цвет); 3 - крупнозернистый фирн (серый
цвет); c - шлифы кернов из тех же горизонтов с кристаллами: 1 - льда; 2 - мелкозернистого фирна; 3 - крупнозерни
стого фирна
188
A.G. Khairedinova et al.
is possible to identify individual stratigraphic layers,
the samples do not need to be cut and melted. In this
without cutting of the samples. In addition, using
study, it was possible to solve the problem experienced
the CT technique allows distinguishing the crystals
by the previous researchers employing the CT tech
composing the individual density layers according
nique, related to maintaining the proper temperature
to their size. In order to test whether the resulting
conditions for the ice. A special cryothermos was de
image also provides information on the size of the
signed, that does not require any special investments,
crystals, a comparison was made with the firn and
as in the case of using a special walk-in freezer labora
ice flat-surface vertical sections. The sections were
tory. However, at this point cryothermos is not com
made for each horizon, distinguished visually by stra
pletely satisfactory and needs to be further improved,
tigraphy for all three sections (a total of 30 thin sec
since it was not able to maintain the proper condi
tions). Subsequently, a comparison was made of ver
tions for the ice for more than 5 hours. Reliable re
tical sections and horizontal core sections using CT.
sults were obtained for the test ice core. That sample
Below we list the most illustrative examples. The
was characterized by a large contrast in composing
horizontal sections of various parts of the core were
media. Density, porosity and structural features of the
obtained using the DataViewer program. In this case,
Elbrus core sections were determined. Correlations
mineral inclusions are absent, therefore the densest
with several (Ca, Fe) chemical elements were found.
layer (ice) is displayed in white. The core section 43
The question of whether it is possible to decipher in
consisted of firn with some ice layers up to 4 cm thick
dividual dust particles in large-scale dust horizons still
(Fig. 5). The ice layers, shown in the first cross sec
remains open and needs further verification. Informa
tion, have a crystal size of up to 6-8 mm. They are
tion on the crystals size can be obtained using the CT
characterized by the highest contrast and are easily
data especially when there is a high contrast with the
detectable on the CT images. The second cross sec
background medium. It should be noted that the ob
tion depicts the firn that is representative for most of
tained CT data were characterized by a large amount
the core used in this study. As seen in the cross sec
of noise. To identify all structural heterogeneities and
tion, the crystals have dimensions on the order of
clearly separate between inclusions and the noise, it is
0,1-0,5 mm. They are not distinguishable on the CT
necessary to carry out the imaging with higher resolu
image and are revealed only as noise. The third sec
tion. This will require substantially greater computer
tion displays a coarse-grained firn, the crystal size of
storage capacity. In further studies, it is necessary to
which reaches 1 mm. Such firn can be identified by
pay close attention to the choice of spatial resolution,
the results of a CT scan. However, there is an ambi
to design a longer-lasting cryothermos for maintaining
guity in the correct interpretation of such horizons
the proper temperature conditions for the ice cores,
associated with a large amount of noise.
and to study a greater number of firn and ice cores to
Thus, the use of computed tomography allowed
fully explore the possibilities of a CT method.
identifying heterogeneities in the structure of the ice
core. They were not recorded when the core was pre
Acknowledgments. The research was supported by the
viously inspected visually. Moreover, in some cases,
Russian Science Foundation (project № 17-17-
it was possible to identify patterns of crystals of dif
01270). We thank I.I. Lavrentiev, A.A. Polukhov,
ferent sizes in the image. However, only contrast
A.A. Abramov and all the participants of the expedi
ing media with a large difference in the size of crys
tion to Elbrus in 2017. We also thank A.M. Grachev
tals are confidently distinguished on the background
for valuable comments and text edits during the man
of fine-grained firn: the ice and coarse-grained firn.
uscript preparation.
Благодарности. Работа выполнена при поддерж
Conclusion
ке Российского научного фонда (проект № 17-
17-01270). Мы благодарим И.И. Лаврентьева,
The method of computed tomography was test
А.А. Полюхова, А.А. Абрамова и всех участников
ed on artificial and actual ice cores. The technique
экспедиции на Эльбрус в 2017 г. Также авторы
has several clear advantages. Compared with microto
выражают благодарность А.М. Грачеву за цен
mography, ordinary CT allows examining samples
ные советы и коррекцию текста во время подго
up to 1 m length. It is non-destructive, meaning that
товки статьи.
189
Ледники и ледниковые покровы
Применение методики компьютерной
стости и структурных особенностях. Установле
томографии для неразрушающего анализа
ны корреляции с рядом химических элементов, а
ледниковых кернов
также явная зависимость оптической плотности
по результатам КТ от содержания кальция. Лед
В настоящее время при изучении ледниковых
никовый керн с глубины 2020-2180 см сложен
кернов используется большое число современных
фирном, наклон которого обусловлен унаследо
методов. Однако многим из них свойственны не
ванностью микрорельефа поверхности и возмож
достатки, связанные с разрушением и таянием об
ными внутренними неоднородностями. Расчё
разца при анализе, что препятствует дальнейшему
ты показали, что угол наклона слоёв в изучаемых
использованию кернов. Компьютерная томогра
секциях изменяется от 6 до 9°.
фия (КТ) - способ получения послойных срезов
Метод компьютерной томографии позволяет
объекта с помощью рентгеновских лучей. Яркость
определить внутреннюю структуру керна. Также
(различные градации серого) на рентгеновской те
по данным КТ можно получить сведения о раз
невой проекции отражает ослабление рентгенов
мерах кристаллов. Было проведено сравнение по
ского излучения за счёт эффектов рассеивания и
перечных срезов кернов КТ со шлифами фирна
поглощения сигнала, прошедшего через образец.
и льда. Шлифы были сделаны для каждого гори
Ослабление зависит от плотности и атомного числа
зонта, различаемого визуально по стратиграфии
материала, из которого состоит изучаемый объект.
для всех трёх секций. Общее число шлифов - 30.
Преимущество метода КТ - его быстрота: затраты
Далее было проведено сопоставление шлифов и
непосредственно на съёмку - минимальные, при
горизонтальных срезов керна по КТ. Установле
этом объём получаемой информации - весьма су
но, что лучше всего кристаллы отображаются при
щественный. В нашей работе использовался ком
большом контрасте с фоновой средой. В данном
пьютерный томограф РКТ-180 на геологическом
керне фоном служил мелкозернистый фирн, на
факультете МГУ имени М.В. Ломоносова. Метод
контрасте с которым в результатах КТ были вы
компьютерной томографии был протестирован на
делены ледяной горизонт и горизонт с крупно
искусственном и настоящем кернах (ледниковые
зернистым фирном. Значительный недостаток
керны с Западного плато Эльбруса). Авторы реши
полученных данных КТ - большое количество
ли проблему, связанную с поддержанием темпера
шумов. При дальнейших работах необходимо с
турных условий льда, которая была у предыдущих
повышенным вниманием подойти к выбору про
исследователей КТ-методики. С этой целью был
странственного разрешения, создать термос с
создан специальный криотермос, поддерживаю
увеличенным временем сохранения температур
щий температуру на уровне -25 °С.
ных условий льда, а также изучить большее число
В результате работы с секциями керна Эль
образцов ледниковых кернов для выявления се
бруса получены данные о его плотности, пори
зонных и годовых закономерностей.
References
from Glacier Ice Cores. Environ. Sci. Technol. 2017, 51
(22): 13282-13287. doi: 10.1021/acs.est.7b03950.
1. Bigler M., Svensson A., Kettner E., Vallelonga P.,
4. Cnudde V., Boone M. High-resolution X-ray comput
Nielsen M., Steffensen J. Optimization of High-Reso
ed tomography in geosciences. A review of the cur
lution Continuous Flow Analysis for Transient Climate
rent technology and applications. 2013, 123: 1-17. doi:
Signals in Ice Cores. Environ. Sci. Technol. 2011, 45
10.1016/j.earscirev.2013.04.003.
(10): 4483-4489. doi: 10.1021/es200118j.
5. Voland V., Freitag J., Uhlmann N., Hanke R. A CT Sys
2. Sneed S., Mayewski P., Sayre W., Handley M., Kur-
tem for the Analysis of Prehistoric Ice Cores. Micro
batov A., Taylor K., Bohleber P., Wagenbach D., Er-
electronic Systems, Springer Berlin Heidelberg. 2011:
hardt T., Spaulding N. New LA-ICP-MS cryocell and
265-276. doi: 10.1007/978-3-642-23071-4_25.
calibration technique for sub-millimeter analysis of ice
6. Nachtrab F., Firsching M., Voland V., Salamon M.,
cores. Journ. of Glaciology. 2015, 61 (226): 233-242.
Schröpfer S., Reisinger S., Wörlein T., Ennen A.,
doi: 10.1016/j.scitotenv.2017.04.187.
Schmitt M., Hebele S., Schlechter T., Uhlmann N. Ap
3. Spaulding N., Sneed S., Handley M., Bohleber P., Kurba-
plication specific computed tomography systems for
tov A., Pearce N., Erhardt T., Mayewski P. A New Mul
core analysis. Intern. Symposium of the Society of
tielement Method for LA-ICP-MS Data Acquisition
Core Analysts held in Avignon. 2014: 1-6.
190
A.G. Khairedinova et al.
7. Zabler S., Fella C., Dietrich A., Nachtrab F., Salamon M.,
Technology, Elsevier. 2017, 138: 24-35. doi: 10.1016/j.
Voland V., Ebensperger T., Oeckl S., Hanke R., Uhl-
coldregions.2017.03.001.
mann N. High-resolution and high-speed CT in indus
12. Voland V., Müller A., Firsching M., Gruber R., Mohr S.,
try and research. Developments in X-Ray Tomography
Habl M.,Schön T., Oeckl S., Schröpfer S., Hess J.,
VIII. 2012, 8506: 1-11. doi: 10.1117/12.964588.
Burtzlaff S., Freitag J., Salamon M., Kessling P.,
8. Reilly B., Stoner J., Wiest J. SedCT: MATLAB™
Jimenez H., Sauer F., Piffl D., Nachtrab F., Uhlmann N.
tools for standardized and quantitative process
Computed Tomography (CT) System For Automatic
ing of sediment core computed tomography (CT)
Analysis Of Ice Cores. European Conference on Non-
data collected using a medical CT scanner. Geo
Destructive Testing (ECNDT). 2010: 1.
chem. Geophys. Geosyst. 2017, 18: 3231-3240, doi:
13. Mikhalenko V., Kutuzov S., Lavrentiev I., Toropov P.,
10.1002/2017GC006884.
Abramov A., Poliukhov A. Glyaciologicheskie issledo-
9. Barnola J-M., Pierritz R., Goujon C., Duval P., Boller E.
vaniya Instituta geografii RAN na Elbruse v 2017. Gla
3D reconstrucion of the Vostok firn structure by X-ray
ciological studies of the Institute of Geography, RAS,
tomography. Materialy Glyatsiologicheskikh Issledo-
on the Elbrus Mount in 2017. Ice and Snow. 2017,
vaniy. Data of Glaciological Studies. 2004, 97: 80-84.
57 (3): 292. doi: 10.15356/2076-6734-2017-3-292. [In
10. Cnudde V., Masschaele B., Dierick M., Vlassen-
Russian].
broeck J., Hoorebeke L., Jacobs P. Recent progress in
14. Mikhalenko V., Sokratov S., Kutuzov S., Ginot P., Le-
X-ray CT as a geosciences tool. Applied Geochem
grand M., Preunkert S., Lavrentiev I., Kozachek A.,
istry. 2006, 21 (5): 826-832. doi: 10.1016/j.apgeo
Ekaykin A., Fain X., Lim S., Schotterer U., Lipen-
chem.2006.02.010.
kov V., Toropov P. Investigation of a deep ice core from
11. Lieb-Lappen R., Golden E., Obbard R. Metrics for in
the Elbrus western plateau, the Caucasus, Russia.
terpreting the microstructure of sea ice using X-ray mi
The Cryosphere. 2015, 9: 2253-2270. doi: 10.5194/
cro-computed tomography. Cold Regions Science and
tc-9-2253-2015.
191