Pis’ma v ZhETF, vol. 109, iss. 8, pp. 507 - 508
© 2019
April 25
Distributions of charged particles’ transverse momentum and
pseudorapidity in pp collisions at 0.9 TeV
Q.Ali+, Y.Ali+1), M.Haseeb+, M.Ajaz∗
+Department of Physics, Commission on Science and Technology for Sustainable Development in the South (COMSATS) University,
Park Road, 44000 Islamabad, Pakistan
∗Department of Physics, Abdul Wali Khan University Mardan, 23200 Mardan, Pakistan
Submitted 14 January 2019
Resubmitted 27 February 2019
Accepted 27
February 2019
DOI: 10.1134/S0370274X19080010
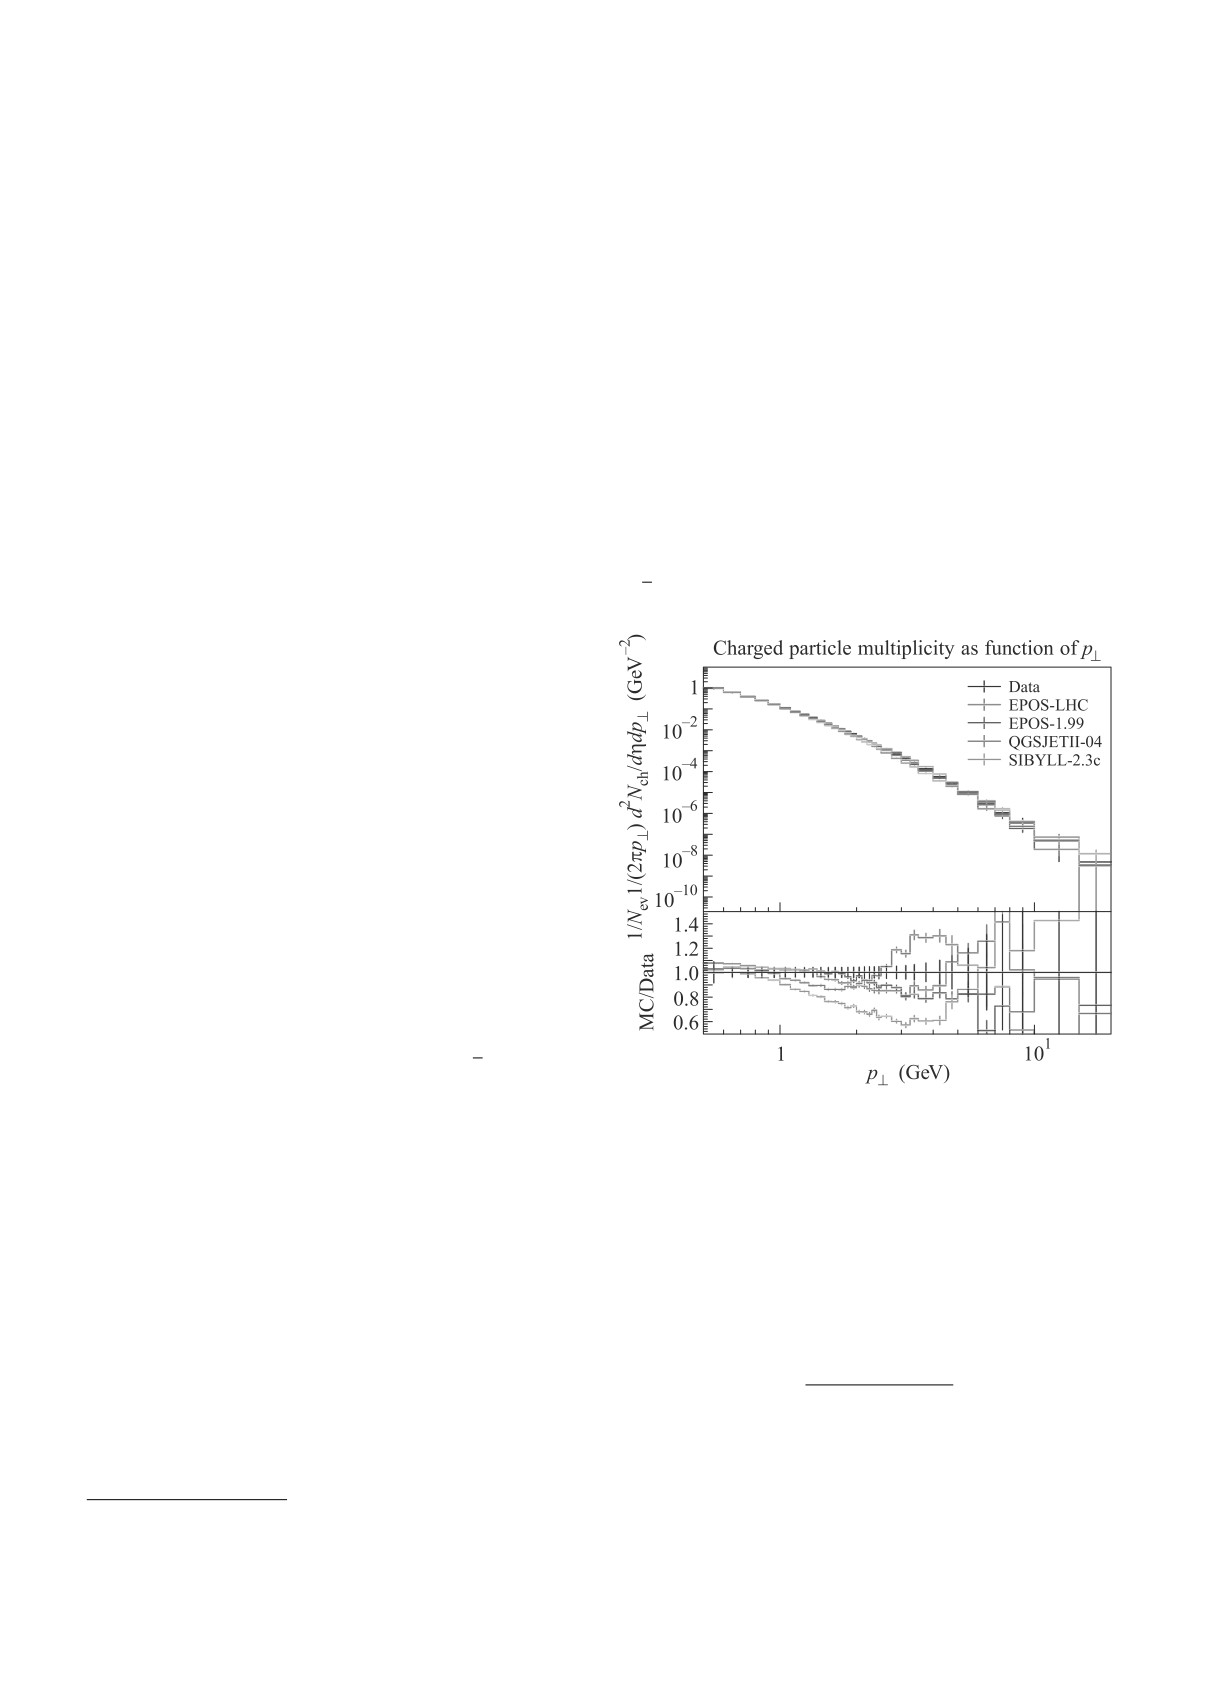
The pT -spectra of hadrons can be used to deduce
lisions for the pseudorapidity interval of |η| < 2.5 at
the mechanism of particle production in (proton-proton)
√s = 0.9 TeV.
pp collisions. The study of charged particle production
in pp collisions at high energies provides dynamics of
hard as well as soft interactions [1-4]. The perturba-
tive Quantum Chromodynamics (pQCD) quantitatively
describe, large momentum transfer, hard parton-parton
scattering processes [5].
Measurements of high-pT charged particles produc-
tion at Large Hadron Collider (LHC) energies play a vi-
tal role to constrain fragmentation and parton distribu-
tion functions in current pQCD calculations of next-to-
Leading-Order (NLO) [6]. However, production of parti-
cle is dominated by soft interactions at low momentum
where most of the particles are produced.
We have studied the charged particles spectra for
the pseudorapidity region of |η| < 2.5, the multiplicity
of charged particles, its dependence on pT as well as on
η and the relationship between average pT and charged
particles multiplicity in pp collisions at
√s = 0.9 TeV.
For simulations, we have used EPOS-LHC, EPOS-1.99,
QGSJETII-04, and SIBYLL-2.3c models and compared
Fig. 1. (Color online) Comparison of the models’ predic-
their predictions with the experimental data of AT-
tions of pT -distributions of the differential yield of hadrons
for |η| < 2.5 with the ATLAS data. Filled circle is used to
LAS experiment. For the pT distribution, predictions
represent experimental data, solid blue line for EPOS-1.99,
of the Sibyll-2.3c are matching with the experimental
solid red line shows EPOS-LHC, solid green line shows the
data in a region of 0.5 < pT < 0.8 GeV/c and EPOS-
QGSJETII-04 and orange yellow shows the SIBYLL-2.3c
1.99 model results are near to the experimental data
model
for 0.5 < pT < 1.5 GeV/c. For the case of average pT ,
EPOS-LHC and Sibyll-2.3c predictions are closer to the
experimental data. For the pseudorapidity charged par-
Full text of the paper is published in JETP Letters
ticle density distributions QGSJETII-04 model predic-
journal. DOI: 10.1134/S0021364019080010
tions are better describing the experimental data.
Figure 1 shows the comparison of charged particle
multiplicity distributions as a function of pT in pp col-
1. F. Abe, D. Amidei, G. Apollinari et al. (Collaboration),
Phys. Rev. Lett. 62, 613 (1989).
2. F. Abe, D. Amidei, and G. Apollinari et al. (Collabora-
1)e-mail: yasir_ali@comsats.edu.pk
tion), Phys. Rev. Lett. 64, 157 (1990).
Письма в ЖЭТФ том 109 вып. 7 - 8
2019
507