

Лесоведение, 2022, № 5, стр. 564-579
Litter turnover and nutrients dynamic in a tropical moist deciduous forest of India
E. K. Ramya a, *, S. Sharmila a, S. Mownika a
a PG and Research Department of Botany, Vellalar College for Women (Autonomous)
Thindal, Erode-12, Tamil Nadu, India
* E-mail: ekramya16@gmail.com
Поступила в редакцию 29.12.2021
После доработки 20.03.2022
Принята к публикации 7.06.2022
- EDN: DOMTRB
- DOI: 10.31857/S0024114822050047
Аннотация
Litter accumulation and leaf decomposition represent the main pathway for nutrient cycling in forest ecosystems. This study investigates four species, Pongamia pinnata (PP), Terminalia arjuna (TA), Gardenia resinifera (GR), and Celtis phillipensis (CP) in a tropical moist deciduous forest of India. The goals of this study were: i) to quantify the dry weight of litter accumulation and litter decay; ii) to define the nutrient composition of litter accumulation and release of nutrients through decomposition; and iii) to estimate the relation between litter mass loss and abiotic variables. Litter samples (five replicates) were collected from a 1 × 1 m square frame placed randomly under the study species. The litter bag technique was used to calculate litter decomposition. The quantity of annual forest floor litter was the highest in PP (1.97 kg m–2 yr–1), followed in decreasing order by TA (1.83 kg m–2 yr–1), CP (1.69 kg m–2 yr–1), and GR (1.62 kg m–2 yr–1), with leaves representing the largest fraction with 61.2% of total litter. Decomposition of leaves was greater in the rainy season, PP and TA leaf litters decomposed faster in 10 months than the GR and CP species. Litter mass loss highly correlated with abiotic components like rainfall (r = 0.998 to 0.999), relative humidity (r = 0.711 to 0.785), and soil moisture (r = 0.382 to 0.839). The differences in decomposition coefficient and half-life periods are related to the structure and nutrient concentration of leaf litter and environmental factors. We can conclude that PP and TA species exhibited the highest weight loss, which may be due to high concentrations of C and N and low concentrations of lignin and cellulose that cause change in nutrients of soil and decomposers as well as the quality of decomposing litter. The forest could play a significant role in mitigation in the context of global climate change.
Forest litter has a significant influence on the forest ecosystem dynamics (Olson, 1963). However, the growth and productivity of forest ecosystems mainly depend on the rate of decomposition of forest floor litter. The decomposition of forest litter is a major pathway for providing organic and inorganic elements for the nutrient cycling processes (Mudrick et al., 1994). At a global scale, aboveground biomass and decomposition rates in tropical ecosystems increase along with mean annual precipitation (Gei and Powers, 2014). The amount of litterfall is directly related to aboveground biomass accumulation (Lawrence, 2005; Chave et al., 2010; Feng et al., 2019). Forest litter minimizes the soil erosion, runoff, and increases the nutrients rate in the soil. A subsequential amount of nutrients taken up by the aboveground component of the tree returns to the soil through litterfall (Saha et al., 2016).
Litter accumulation needs some significant factors like light, heat, and water, all of which have a complex impact on the abiotic environment. Litter acts as a mechanical barrier, intercepting light and altering the spectral structure. It also reduces soil temperature during the day by decreasing solar radiation absorption, but increases soil temperature at night by reducing heat loss (Jensen and Gutekunst, 2003). Additionally, litter accumulation may delay the freezing of the soil in the winter season, while soil temperature decreases too, which indirectly increases the soil moisture (Facelli and Pickett, 1991). Litter can directly increase the soil moisture by reducing water evaporation. In addition, litter accumulation can increase snow capture and retention in winter and soil moisture in early spring, but the interception effect of litter reduces infiltration by rainfall (Naeth et al., 1991). Therefore, an understanding of the modified microenvironment is crucial to elucidate the role of litter accumulation in regulating plant communities (Hou et al., 2019).
Litter decomposition plays a crucial role in the nutrient composition of forest ecosystems, where vegetation depends mainly on the recycling of nutrients in the plant detritus. During this process, plant nutrients become available for recycling within the ecosystem (Saha et al., 2016). The decomposition rate of litter controls nutrient release in the soil. The balance between litter production and its decomposition also controls the size of the carbon reservoir in the soil (Kurz et al., 2000). Soil properties, nutrient availability, temperature, water availability, and leaf litter quality are the main factors that determine the decomposition rate of litter (Zhang et al., 2014; Giweta, 2020). The decomposition of leaf litter is a major source of nutrients in forest ecosystems. As leaves are broken down by insect and microbial decomposers, organically bound nutrients are released as free ions to the soil solution which is then available for uptake by plants. The substrate quality index includes nitrogen concentration, the ratio of carbon to nitrogen, lignin concentration, and the ratio of lignin to nitrogen (Devi and Yadava, 2010). Litter quality affects not only the rate of mass loss, but also the patterns and rates of nutrient mineralization and release (Regina, 2001). Climatic features such as temperature, rainfall, and their seasonal variations, may influence the activity of microbes and soil fauna that can significantly affect the decomposition rate. In addition, litter serves as an intermediary between vegetation and soil and is a major substrate for soil microorganisms influencing their activities (Averti et al., 2018). The litter diversity also influences the activity of soil communities and processes during decomposition (Chapman and Koch, 2007).
Thus, investigating the decay constant and associated C and N in each and every species can play a critical role. The determination of annual litter accumulation associated with C and N in each species is fundamental in getting an understanding of terrestrial C and N cycles and how they enhance the litter decay. In litter decomposition, constant and nutrient release patterns are species-specific and correlate with quality, including chemical composition, season, and environmental factors of tropical forests in India. Therefore, works were performed: i) to quantify the dry weight of litter accumulation and litter decay; ii) to define the nutrient composition of litter accumulation and release of nutrients through decomposition; and iii) to estimate the relation between litter mass loss and abiotic variables in four different species of Western Ghats, India.
MATERIALS AND METHODS
Characteristics of study area. The study was conducted in the Veerakkal forest area, Manar Beat, Karamadai Range, Western Ghats, India (11°13.849′ 76°45.052′ alt. 476 m). The forest vegetation is dominated by Pongamia pinnata, Terminalia arjuna, Gardenia resinifera, and Celtis phillipensis. The forest vegetation falls under the tropical moist deciduous type with a warm moist climate in summer and cool dry one in winter. The study explored three distinct seasons: summer (March–May), the rainy season (June–November), and winter (December–February).
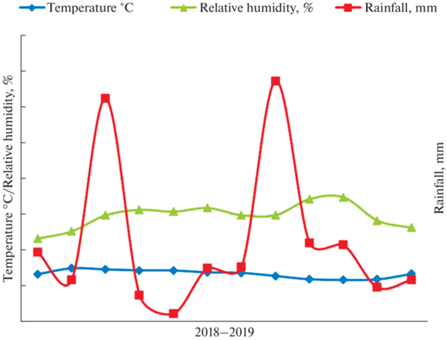
Meteorological data such as temperature, rainfall, and relative humidity of the species was investigated for the study period and visualized in Fig. 1. The overall examination of meteorological data shows that the monthly average temperature in the study area ranged between 23.9°C and 30.3°C. Moreover, the intensity of solar radiation was generally high in March through May. The annual precipitation in the study species ranged from 600 to 850 mm. The relative humidity of the area ranged between 47% and 70%.
Forest floor and litter accumulation. The forest floor (litter on the soil surface) was studied from March 2018 to February 2019 for all four species during different seasons. Twenty sets of litter samples (five replicates) were collected using a 1 m × 1 m square frame placed randomly. The samples were collected with seasonal intervals (in May, November, and February) and transported to a laboratory in polythene bags. Forest litter samples were sorted into leaf, twig, and mixed fractions. The dry weight of each component sample was oven-dried at 80°C for 48 hours and weighed (g/m2).
Chemical analysis of forest floor components. The litter samples were analyzed for nutrient composition such as nitrogen, phosphorus, and potassium. Different seasonally collected litter materials were oven-dried at 80°C for 48 hours and powdered for chemical analysis. In the course of the chemical analysis, five replicates were used for each species. Total nitrogen in the litterfall was determined by using the micro Kjeldahl method (Snell and Snell, 1949). The estimation of phosphorus and potassium followed the method of Olsen et al. (1954) and Black (1965).
Estimation of the nutrient turnover constant (K) and time (t). The turnover constant of nutrients is the rate of nutrients released in available forms for uptake by plants and soil organisms (Jenny et al., 1949). The turnover constant (K) of different nutrients in the forest floor was estimated by using the following formula:
where K means turnover rate, A means annual input of nutrients, and F means residual mass of litter and nutrients on the forest floor (minimum mass).The turnover time of nutrients is the time required for nutrients release in available forms for uptake by plants and soil organisms.
Turnover time (t) was calculated as reciprocal of turnover rate, i.e.
t = 1/K,
where t means time, and K means turnover rate.
Litter bag technique. Freshly fallen leaves from the four species were collected during February 2018 for a decomposition study. All the leaves were air-dried for 48 hours after species-wise pooling of the samples from different species in a ventilation room.
A certain amount of air-dried leaf litter (20 g) of each species was collected into 20 × 20 cm nylon mesh bags (mesh size 2 mm) and placed on the forest floor at the soil depth of 10 cm. A total of 168 litter bags (42 × 4 = 168) were prepared for the study species. For each species, 42 litter bags were randomly placed on the forest floor with the respective species at the end of February 2018. After that, seven bags for each species were recovered in alternate month intervals in up to one year. The litter bag mesh size (2 mm) may decrease the rate of decomposition, because it restricts the entry of large invertebrates, scavengers, etc.
Dry weight loss. During selected month intervals from March 2018 to February 2019 (samples were collected at the end of April, June, August, October, December, and February), seven litter bag samples from each species were collected (7 × 4 = 28) and transported to the laboratory. Finally, a total of 168 litter bags were collected for all study species (28 × 6 = 168). Hereafter, large arthropods were removed from the litter bag. Litter samples were then oven-dried at 80°C and weighed to determine the remaining litter weight, litter weight loss, cumulative weight loss, and weight loss calculated from the original litter weight.
Decomposition coefficient (k). Decomposition coefficient (k) is a parameter to determine the rate of decomposition in a certain species. The decomposition coefficient for each species was calculated by using the method of Olson (1963):
k = A/L,
where A means annual litterfall, L means quantity of litter accumulation at (mean annual) time t.
Decomposition rate. Decomposition rate was calculated by using the method of Pascal (1992). Decomposition rate (in years): for 50% = 0.693/k, for 95% = = 3/k, where 0.693 and 3 are constant values.
Chemical analysis. The concentration of organic carbon, total nitrogen, lignin, cellulose, and water-soluble compounds were determined in the initial and decomposing litter samples. The methods were also used during the estimation of organic carbon (Piper, 1950), total nitrogen (Jackson, 1958), lignin (Goering and Van Soest, 1975), cellulose (Updegraff, 1969), and water-soluble compounds (Do et al., 2014).
Statistical analysis. The data on seasonal litter accumulation and chemical analysis was assessed using one-way ANOVA. All tests were considered to have significant differences using Duncan’s multiple range test (DMRT) with p < 0.05. The relations between litter weight loss, initial litter chemistry, and abiotic variables were tested using Pearson’s correlation coefficient analysis and showed significant differences using DMRT with p < 0.05 and p < 0.01. The statistical analysis was performed using the software SPSS (version 16.0).
RESULTS AND DISCUSSION
Dry weight of forest floor litter. The seasonal dry weight of the forest litter was statistically significant with the results of ANOVA (p < 0.05) (Table 1). Like litterfall, Pongamia pinnata showed maximum forest floor litter (1.03 k m–2) in summer. At the time, the minimum floor litter was observed in Gardenia resinifera (0.69 kg m–2) during the same season. In the rainy season, forest floor litter was observed highest in Celtis phillipensis (0.61 kg m–2) and lowest in Pongamia pinnata (0.57 kg m–2). Together, in the winter season, the highest value of litter was found in Terminalia arjuna (0.47 kg m–2) and the lowest was observed in Gardenia resinifera (0.35 kg m–2). Moreover, a decreased soil temperature also indirectly improves the soil moisture. The litter accumulation in the wet season is less compared to the dry season in the tropical forest ecosystem. The previous seasonal litter accumulation studies ranged between 1.22 to 1.27 kg m–2 during the rainy season, and 0.61 to 0.98 kg m–2 during the summer season in Urban Tropical Forest, Congo (Averti et al., 2018). Similarly, Kavvadias et al. (2001) have showed in their studies that forest litter dry weight of fir forest species ranged between 82 t ha–1 and 32 t ha–1 under the maritime pine species in the forest ecosystem of Northern Greece. Similar results were noted by Sundarapandian and Swamy (1999), Qiulu et al. (1998), Liu (2012) and Giebelmann et al. (2013).
Table 1.
Seasonal litter accumulation (g/m2) in different species of Veerakkal forest area, Manar beat, Karamadai Range, the Western Ghats
| Mar. 2018 –Feb. 2019 | Pongamia pinnata | Terminalia arjuna | Gardenia resinifera | Celtis phillipensis | ||||||||||||
|---|---|---|---|---|---|---|---|---|---|---|---|---|---|---|---|---|
| seasons | leaf | twig | mixed fractions | total | leaf | twig | mixed fractions | total | leaf | twig | mixed fractions | total | leaf | twig | mixed fractions | total |
| Summer (Mar–May) | 686 ± 3a | 160 ± 2a | 182 ± 3a | 1028.5 | 503 ± 3 a | 179 ± 2a | 92 ± 2a | 775.38 | 448 ± 5a | 132 ± 1a | 105 ± 2b | 685.98 | 406 ± 2a | 128 ± 2a | 159 ± 2a | 694 |
| Rainy season (Jun–Nov) | 360 ± 4b | 99 ± 4b | 110 ± 2b | 570.2 | 350 ± 3b | 141 ± 3b | 96 ± 2a | 588.32 | 315 ± 2b | 128 ± 3a | 135 ± 2b | 580.26 | 386 ± 3b | 90 ± 1b | 131 ± 1a | 608.62 |
| Winter (Dec–Feb) |
223 ± 4c | 59 ± 1c | 83 ± 2c | 367.54 | 305 ± 1c | 90 ± 1c | 73 ± 4b | 470.52 | 190 ± 4c | 87 ± 1b | 73 ± 1c | 351.08 | 223 ± 2c | 74 ± 2c | 89 ± 1c | 388.32 |
| Total | 1270.54 | 319.24 | 376.46 | 1966.24 | 1158.7 | 411.92 | 263.6 | 1834.22 | 953.92 | 348.8 | 314.6 | 1617.32 | 1016.1 | 294.16 | 380.68 | 1690.94 |
| Mean | 423.51 | 106.41 | 125.49 | 655.41 | 386.23 | 137.31 | 87.87 | 611.41 | 317.97 | 116.26 | 104.86 | 539.10 | 338.7 | 98.05 | 126.89 | 563.64 |
| F = = df(2,14) | 3.760*** | 254.619*** | 317.773*** | – | 1.389** | 265.088*** | 17.507*** | – | 973.456*** | 83.167** | 415.671** | – | 852.389** | 180.961*** | 113.004** | – |
In an overall assessment, the quantity of annual forest litter was highest in PP (1.97 kg m–2 yr–1) followed in decreasing order by TA (1.83 kg/m2/yr), CP (1.69 kg/m2/yr), and Gardenia resinifera (1.62 kg/m2/yr); it indicates highest and lowest basal area of tree species. Overall, the forest litter was reduced in the rainy season possibly due to a variety of macroclimatic conditions in terms of effective monsoon rainfall. The forest litter in tropical and subtropical forests ranged from 0.22 to 1.25 kg m–2 yr–1 (Spain, 1984 and Vogt et al., 1986). Comparatively, in all study species, the higher forest litter mostly occurred during summer and the least occurred during winter. Likewise, the forest litter mass was found to be same trend as litter fall production. The similar findings were documented earlier by Pandey and Singh (1981), Goma-Tchimbakala et al. (2005) and Wang et al. (2008). Although, the contribution of the leaf litter component was maximum in the total forest litter in all four species, closely followed by the mixed fractions and twig components.
Chemical composition of forest litter components
Total Nitrogen. The total nitrogen concentrations were statistically significant with the results of ANOVA (p < 0.05). The annual total nitrogen content for all four study species ranged between 0.73 ± 0.03 to 2.12 ± 0.07% during all seasons (Fig. 2a). Together, the results of current study indicate that the range of nitrogen concentration was higher in winter in all four species, followed by summer and the rainy season. However, the study species Pongamia pinnata showed the maximum nitrogen concentration in the winter season (2.12 ± 0.07% leaf, 1.68 ± 0.04% twig, and 1.76 ± 0.05% mixed fractions, respectively) while Celtis phillipensis exhibited the minimum nitrogen concentration in the same season (1.46 ± 0.03% leaf, 1.11 ± 0.03% twig and 1.32 ± 0.06% mixed fractions respectively) in all four study species. Likewise, nitrogen concentration of the forest floor ranged between 4.03 ± 0.26 and 17.38 ± 1.39 t/ha in the forest ecosystem of Northern Greece (Kavvadias et al., 2001). Moreover, litter accumulation can alter biogeochemical nutrient cycles through its decomposition (Moretto et al., 2001; Wang et al., 2017), as well as soil bacterial components and diversity (Hossain et al., 2010; Zeng et al., 2017).
Fig. 2.
N, P and K concentration of forest floor litter components in the study species. L – Leaf, T – Twig, M – Miscellaneous.
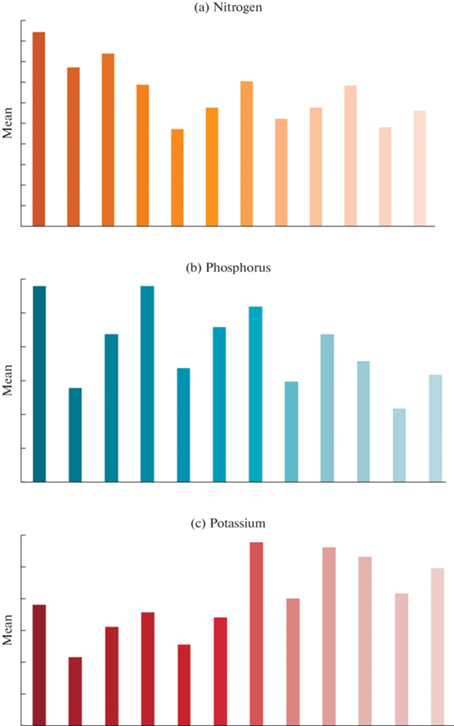
In the summer season, the highest nitrogen content was reported in PP, while the lowest content of nitrogen was found in GR, respectively. Although in the rainy season, PP showed the maximum nitrogen concentration, and CP showed the minimum amount of nitrogen concentration in all seasons.
Total Phosphorus (%). The seasonal phosphorus concentrations of all the study species exhibited statistically significant (p < 0.05) differences in the forest litter components (Fig. 2b). The total phosphorus content in all the species ranged between 0.08 ± 0.04 to 0.37 ± 0.03% during all the seasons. According to the results of comparative analysis, the higher phosphorus content was recorded in winter season, simultaneously decreasing in the rainy season. During the winter season, the highest phosphorus concentration was observed in Pongamia pinnata (0.37 ± 0.03% in leaf, 0.21 ± 0.02% in twig and 0.27 ± 0.05% in mixed fractions, respectively) and the lowest phosphorus concentration was found in Celtis phillipensis (0.22 ± 0.06% leaf, 0.11 ± 0.03% twig and 0.17 ± 0.02% mixed fractions, respectively). Together, the maximum phosphorus content was noted in TA and the minimum phosphorus content was recorded in CP during the summer and rainy seasons. The phosphorus content of floor litter ranged between 0.44 ± 0.08 to 0.82 ± 0.09 t/ha in the forest ecosystem of Northern Greece (Kavvadias et al., 2001). The litter in forests with high tree diversity decomposes more rapidly than in other forest types (Chaubey et al., 1988; Clark et al., 2001; Giweta et al., 2020).
Total Potassium (%). The total potassium content of all the study species is visualized in Fig. 2c. In the present study, the total potassium content of forest litter samples was statistically significant (p < 0.05). On the other hand, the total potassium content for all seasons ranked between 0.35 ± 0.06 to 1.24 ± 0.04% in all four species. In addition, the winter season registered higher potassium concentration followed by summer and the rainy season in all the study species. However, in all three seasons, Gardenia resinifera showed the highest potassium content in floor litter components (1.08 ± 0.04 to 1.24 ± 0.04% leaf, 0.73 ± 0.04 to 0.85 ± 0.02% twig and 1.10 ± 0.02 to 1.17 ± 0.03% mixed fractions, respectively) and the lowest potassium content was found in PP (0.69 ± 0.03 to 0.87 ± 0.04% leaf, 0.35 ± 0.06 to 0.54 ± 0.03% twig and 0.58 ± 0.05 to 0.70 ± 0.07% mixed fractions, respectively). The leaf litter with significantly higher NPK content has a faster decay constant (Quideau et al., 2005).
Potassium is a highly mobile element, both in plants and in the soil, which is reflected in a high variability of its concentration detected in leaves. The potassium content ranged between 0.73 ± 0.12 to 1.57 ± 0.17 t ha–1 in the forest ecosystem of Northern Greece (Hyvarinen, 1990; Gonzalez et al., 2020; Kavvadias et al., 2001). Considering the nutrient accumulation in the forest litter, the nitrogen concentration was highest, followed by potassium and phosphorus. In addition, the proportion of all nutrients was significantly greater in the leaf litter component compared to other litter components. Based on the above results, the concentration of all nutrients was found to peak during the winter season and be at its lowest during the rainy season. The authors recorded the mobilization of nutrients during decomposition in the rainy season, which may be a possible reason for a lower content of nutrients during that period. The poor rate of decomposition during dry months may result in immobilization of nutrients in the forest floor litter (Das and Ramakrishnan, 1985).
Turnover constant (K) of nutrients. The turnover constant (K) values of litter accumulation nutrients for all four species are shown in Table 2. During all the seasons, the mean highest turnover constant of nitrogen was recorded in PP (0.53), and the lowest was seen in GR (0.33). The turnover constant of nitrogen was 0.921 in Quercus serrata and Lithocarpus dealbata, and Schima wallichi was 0.923 in sub-tropical forests of India (Devi and Yadava, 2010), which are the highest values in this study. Although, the maximum turnover of phosphorus was observed in GR (0.44) and the minimum one was found in CP (0.32). Additionally, the turnover constant of potassium was considered the highest in PP (0.45) and the lowest in TA (0.38). On the other hand, leaf litter holds higher nutrient turnover (0.43 to 0.62) for all the study species. The twig and mixed fractions of litter showed lower turnover nutrients (0.19 to 0.56) in all the study species. The low nutrient litter may be characterized by a slower turnover or higher immobilization rates (Kumar and Deepu, 1992). The soft tissues present in the leaf part result in a higher decomposition constant, hence a higher turnover of nutrients (Gosz et al., 1976). Similar studies were conducted earlier by Cortina and Vallejo (1994); Kavvadias et al. (2001).
Table 2.
Turnover constant (K) of nutrients (N, P and K) in the study species
| Different Species | Litter parts | Turnover constant (K) = A/A + F | ||
|---|---|---|---|---|
| N | P | K | ||
| Pongamia pinnata | Leaf | 0.62 | 0.50 | 0.58 |
| Twig | 0.56 | 0.47 | 0.47 | |
| Mixed fractions | 0.41 | 0.32 | 0.29 | |
| Mean | 0.53 | 0.43 | 0.45 | |
| Terminalia arjuna | Leaf | 0.53 | 0.50 | 0.54 |
| Twig | 0.34 | 0.36 | 0.34 | |
| Mixed fractions | 0.30 | 0.30 | 0.27 | |
| Mean | 0.39 | 0.38 | 0.38 | |
| Gardenia resinifera | Leaf | 0.48 | 0.60 | 0.59 |
| Twig | 0.26 | 0.39 | 0.40 | |
| Mixed fractions | 0.25 | 0.33 | 0.34 | |
| Mean | 0.33 | 0.44 | 0.44 | |
| Celtis phillipensis | Leaf | 0.49 | 0.43 | 0.58 |
| Twig | 0.34 | 0.36 | 0.39 | |
| Mixed fractions | 0.20 | 0.19 | 0.25 | |
| Mean | 0.34 | 0.32 | 0.41 | |
Turnover time (t) of nutrients. The turnover time (t), mandatory for the replacement of litterfall and forest floor nutrients of study species, was calculated and represented in Table 3. During the study, the mean nitrogen turnover time of litter components was the highest in CP (3.33 years) and the lowest in PP (1.95 years) for all the seasons. The higher complete turnover of phosphorus was found to be 3.46 years in CP and at its minimum, which is 2.42 years, in both PP and GR. Further, the potassium turnover was the highest in TA (2.83), and the turnover time was lowest in GR (2.38) for all the seasons. The nutrients turnover time ranged between 20.3 and 24.3 years for pine forests, 33 years for fir forests and 14.7 to 18.9 years for beech forests in Greece which, compared to the deciduous forest, is more time for a complete turnover of nutrients (Kavvadias et al., 2001). Typically, a complete turnover for all the species of forest floor litter takes more than one year. The turnover of leaf litter nutrients was faster (1.61–2.33 years) than that of other litter components. The twig and mixed fractions required more years for the replacement of nutrients (2–5 years) in all the study species. The turnover time of leaf litter nutrients for Marao, Padrela, and Bornes was 1.67 years, 2.22 years, and 2.12 years, respectively in the high forest stands of Northern Portugal. Moreover, twig and mixed fractions required more years for the replacement of nutrients (2 to 5 years) in all the study species. The non-leaf litter parts required 2.8 to 4.6 years for a complete turnover of floor litter nutrients in Portugal (Patricio et al., 2012), which is quite similar to the values reported in the present study.
Table 3.
Turnover time (t) of nutrients (N, P and K) in the study species
| Different Species | Litter parts | Turnover time (t) = 1/K | ||
|---|---|---|---|---|
| N | P | K | ||
| Pongamia pinnata | Leaf | 1.61 | 2.00 | 1.72 |
| Twig | 1.79 | 2.13 | 2.13 | |
| Mixed fractions | 2.44 | 3.13 | 3.45 | |
| Mean | 1.95 | 2.42 | 2.43 | |
| Terminalia arjuna | Leaf | 1.89 | 2.00 | 1.85 |
| Twig | 2.94 | 2.78 | 2.94 | |
| Mixed fractions | 3.33 | 3.33 | 3.70 | |
| Mean | 2.72 | 2.70 | 2.83 | |
| Gardenia resinifera | Leaf | 2.08 | 1.67 | 1.69 |
| Twig | 3.85 | 2.56 | 2.50 | |
| Mixed fractions | 4.00 | 3.03 | 2.94 | |
| Mean | 3.31 | 2.42 | 2.38 | |
| Celtis phillipensis | Leaf | 2.04 | 2.33 | 1.72 |
| Twig | 2.94 | 2.78 | 2.56 | |
| Mixed fractions | 5.00 | 5.26 | 4.00 | |
| Mean | 3.33 | 3.46 | 2.76 | |
Dry weight loss. The loss of litter weight for the four study species includes remaining litter mass, weight loss percent, cumulative weight loss, and weight loss calculated based on the original litter weight of leaf litters (Table 4). In the present study, the leaf litter in litter bags decreased linearly within the period of decomposition. Over the tenth month of decomposition, cumulative weight loss was 94.1% in Pongamia pinnata and 95.6% in Terminalia arjuna while the litter loss of Gardenia resinifera and Celtis phillipensis were 93.35% and 83.80%, respectively. However, over the twelfth month, Pongamia pinnata, Terminalia arjuna, and Gardenia resinifera decomposed completely (100% weight loss), but Celtis phillipensis leaf litter decomposed by 97%. Also, Pyrus pyrifolia leaf litter decomposed by 97.67% and Tectona grandis decomposed by 99%, whereas in Eucalyptus tereticornis decomposed by 87.70% as was found within 10 months in Punjab, India (Rani et al., 2016). The rate of litter decomposition is largely a determining factor for productivity of the forest ecosystems, as plant nutrients became available for recycling within the system during litter decomposition, which accounts for 69–87% of the total essential elements for the forest plants required every year (Ifo, 2010).
Table 4.
Dry weight loss of decomposing leaf litter in the study species
| Pongamia pinnata | |||||
|---|---|---|---|---|---|
| Seasons | Feb. 2018– Feb. 2019 | Litter weight remaining , g | Litter weight loss, % | Cumulative Weight loss, % |
Weight loss calculated from original litter weight, % |
| Feb 2018 | 20 | 0 | 0 | 13.6 | |
| Summer | Apr | 17.28 ± 0.3 | 13.6 | 13.6 | 12.25 |
| Rainy | Jun | 14.83 ± 1.0 | 14.18 | 25.85 | 20.05 |
| Aug | 10.82 ± 0.6 | 27.04 | 45.9 | 31.95 | |
| Oct | 4.43 ± 0.7 | 59.06 | 77.85 | 22.15 | |
| Winter | Dec | 1.18 ± 0.5 | 73.36 | 94.1 | 16.25 |
| Feb 2019 | 0 | 100 | 100 | – | |
| Terminalia arjuna | |||||
| Feb 2018 | 20 | 0 | 0 | 16.4 | |
| Summer | Apr | 16.72 ± 0.8 | 16.4 | 16.4 | 13.95 |
| Rainy | Jun | 13.93 ± 0.4 | 16.68 | 30.35 | 18.8 |
| Aug | 10.17 ± 0.2 | 26.99 | 49.15 | 22.4 | |
| Oct | 3.69 ± 0.3 | 63.72 | 81.55 | 32.4 | |
| Winter | Dec | 0.88 ± 0.4 | 76.15 | 95.6 | 14.05 |
| Feb 2019 | 0 | 100 | 100 | – | |
| Gardenia resinifera | |||||
| Feb 2018 | 20 | 0 | 0 | 22.5 | |
| Summer | Apr | 15.5 ± 0.3 | 22.5 | 22.5 | 14.15 |
| Rainy | Jun | 12.67 ± 0.2 | 18.25 | 36.65 | 19.35 |
| Aug | 8.80 ± 0.6 | 30.54 | 56.0 | 16.15 | |
| Oct | 4.57 ± 0.1 | 48.07 | 77.15 | 21.15 | |
| Winter | Dec | 1.33 ± 0.2 | 70.89 | 93.35 | 16.2 |
| Feb 2019 | 0 | 100 | 100 | – | |
| Celtis phillipensis | |||||
| Feb 2018 | 20 | 0 | 0 | 7.55 | |
| Summer | Apr | 18.49 ± 0.4 | 7.55 | 7.55 | 14.9 |
| Rainy | Jun | 15.51 ± 0.2 | 16.12 | 22.45 | 20.2 |
| Aug | 11.47 ± 0.1 | 26.04 | 42.65 | 29.85 | |
| Oct | 5.50 ± 0.5 | 52.05 | 72.5 | 11.3 | |
| Winter | Dec | 3.24 ± 0.2 | 41.09 | 83.8 | 13.2 |
| Feb 2019 | 0.60 ± 0.2 | 81.48 | 97.0 | – | |
In comparison, Pongamia pinnata and Terminalia arjuna leaf litters decomposed faster than other species (10 months), while it took Celtis phillipensis the longest to decompose (12–13 months). Simultaneously, Gardenia resinifera leaf litter lost its mass completely within the period of 11 months. Similarly, Macaranga peltate and Terminalia paniculata leaves lost their mass completely within the period ranging from 10 to 12 months in the tropical deciduous forest, Kodayar, Western Ghats (Sundarapandian and Swamy, 1999). The time it took for the original biomass of Artocarpus chaplasha leaf litter to decompose equals to 10 months (Sarkar et al., 2016). Also, Vatica lanceaefolia and Magnolia hookeri decomposed in 9 and 7 months in Hollongapar, Assam.
On the other hand, the rate of litter decomposition was faster during the initial period of 2–3 months, followed by a slower decomposition rate and again much faster rate in the wet season. The rate of litter decomposition was high in August to October, which corresponds to the rainy season as compared to the dry and winter season. Furthermore, all study species exhibited a rapid mass loss during the rainy season and a slower one in winter season; because weight loss was the highest in the rainy season, it might be due to physical determinants, particularly soil moisture content, temperature, and evapotranspiration for the decomposer activity (Tripathi et al., 2009; Saha et al., 2016; Sarkar et al., 2016).
Decomposition coefficient. The decomposition coefficient is a valuable ecosystem constant that characterizes the decomposition rate as the segment of the litter standing crop decompose annually (Jenny et al., 1949; Swift et al., 1979). The decomposition rates (decomposition coefficient) of litter for the four study species are displayed in Table 5. The annual decomposition coefficient (k) were the highest in Pongamia pinnata (2.52), followed by Gardenia resinifera (2.28), Terminalia arjuna (2.18), and Celtis phillipensis (2.11), respectively. The tree species are recognized to modify the floor litter decomposition through long-term plant-soil interactions (Pascal, 1992; Jaryan et al., 2014). Generally, the rate of decomposition of foliar litter was higher in PP, which was revealed due to a fairly high annual decomposition coefficient (k). Similarly, the decomposition coefficient for the leaf component was typically >1.0 per year while compared to other litter components in all four study species.
Table 5.
Decomposition coefficient (k) and decomposition rate of litter components in the study species
| Species | Litter parts | Decomposition coefficient | Decomposition rate | |
|---|---|---|---|---|
| k = A/L | for 50%(t50) (0.693/k) | for 95% (t95) (3/k) | ||
| Pongamia pinnata | Leaf | 1.17 | 0.59 | 2.56 |
| Twig | 0.83 | 0.83 | 3.61 | |
| Mixed fractions | 0.52 | 1.33 | 5.77 | |
| Total | 2.52 | 0.27 | 1.19 | |
| Terminalia arjuna | Leaf | 1.14 | 0.61 | 2.63 |
| Twig | 0.47 | 1.47 | 6.38 | |
| Mixed fractions | 0.57 | 1.21 | 5.26 | |
| Total | 2.18 | 0.32 | 1.38 | |
| Gardenia resinifera | Leaf | 1.22 | 0.57 | 2.46 |
| Twig | 0.55 | 1.26 | 5.45 | |
| Mixed fractions | 0.51 | 1.35 | 5.88 | |
| Total | 2.28 | 0.30 | 1.32 | |
| Celtis phillipensis | Leaf | 1.13 | 0.61 | 2.65 |
| Twig | 0.65 | 1.07 | 4.61 | |
| Mixed fractions | 0.33 | 2.10 | 9.09 | |
| Total | 2.11 | 0.33 | 1.42 | |
According to the results, the time required for half-life loss (t50) of leaf litter part was reported to be <1.0 year for decomposition (i.e., 0.57 to 0.61 years), although the twig and mixed components were found to be greater than one year (>1.0) for litter loss in all the study species. On the other hand, 95% leaf litter loss (t95) was found to be greater than 2 years (>2.0). Whatever, twig litter components required over three years (>3.0) for decomposition, while mixed fractions of litter required a maximum of 5 to 9 years for 95% decomposition in all four study species.
Comparative data of decomposition coefficient (k) at the global level. The annual decomposition coefficient (k) for all four study species was compared to some other forests at the global level (Table 6). Coefficient value of Quercus gambelii indicated (2.50) in tropical forests of America (Gonzalez and Seastedt, 2001) and 2.01 to 2.59 in lowland tropical rain forests of Malaysia (Dent et al., 2006). Likewise, the decay constant of Casuarina equisetifolia was 1.83 in Pudukkottai tropical forest (Uma et al., 2014) and 3.29 in a tropical forest of Western Himalaya (Jaryan et al., 2014), which indicates more or less closer values to the present study.
Table 6.
Decomposition coefficient (k) of the four study species in comparison with other forests at the Global level (during the period from 1999 to 2016)
| Country and locality | Type of formation | Decomposition coefficient (k = A/L) | Authors |
|---|---|---|---|
| 1. America | |||
| Colorado | Tropical and Sub-alpine forest | ||
| Quercus gambelii | 2.50 | Gonzalez and Seastedt (2001) | |
| Cecropias cheberiana | 5.00 | Gonzalez and Seastedt (2001) | |
| 2. China | |||
| Tropical riparian species and Upland | 1.27 1.90 | Ruan et al. (2005) | |
| Sub-tropical monsoon | |||
| Cunninghamia lanceolata | 1.16 | Yang et al. (2004) | |
| Ormosia xylocarpa | 4.62 | Yang et al. (2004) | |
| Fokienia hodginsii | 3.92 | Yang et al. (2004) | |
| Castanopsis kawakamii | 4.46 | Yang et al. (2004) | |
| Michelia macclurei | 0.99 | Wang et al. (2008) | |
| 3. Europe | |||
| Belgium | European forest | 0.38 | Portillo – Estrada et al. (2016) |
| 4. Malaysia | Lowland tropical rain forest | ||
| Alluvial forest | 2.55 | Dent et al. (2006) | |
| Sandstone ridge forest | 2.59 | Dent et al. (2006) | |
| Sandstone valley forest | 2.01 | Dent et al. (2006) | |
| 5. India | |||
| Madurai | Tropical forest | 0.40 | Sundarapandian and Swamy (1999) |
| Manipur | Sub-tropical forest | ||
| Schima wallichi | 0.33 | Bijayalaxmi Devi and Yadava (2010) | |
| Quercus serrata | 0.46 | Bijayalaxmi Devi and Yadava (2010) | |
| Lithocarpus dealbata | 0.54 | Bijayalaxmi Devi and Yadava (2010) | |
| Himachal Pradesh | Western Himalaya | 3.29 | Vikrant jaryan et al. (2014) |
| Pudukkottai | Casuarina equisetifolia | 1.83 | Uma et al. (2014) |
| Assam | Tropical semi evergreen forest | ||
| Atrocarpus chaplasha | 3.23 | Sarkar et al. (2016) | |
| Vatica lanceaefolia | 3.28 | Sarkar et al. (2016) | |
| Lagerstroemia speciosa | 7.82 | Sarkar et al. (2016) | |
| Magnolia hookeri | 5.90 | Sarkar et al. (2016) | |
| Tamil Nadu | Tropical moist deciduous forest | ||
| Western Ghats | Pongamia pinnata | 2.52 | Present study species |
| Karamadai forest | Terminalia arjuna | 2.18 | Present study species |
| Gardenia resinifera | 2.28 | Present study species | |
| Celtis phillipensis | 2.11 | Present study species |
Initial chemical characteristics of leaf litter. The initial concentration of chemical substances such as organic carbon, total nitrogen, lignin, cellulose, water soluble compounds, C/N ratio, and lignin/N ratio of leaf litter, are vital for the decay process. Litter decomposition rates vary greatly among the species that decompose in identical environments. These alterations in decomposition are mainly due to differences in litter traits, such as leaf toughness, nitrogen, lignin, C/N ratio, and lignin/nitrogen ratio. Among the various traits, nitrogen and lignin content of plant material are the most significant in regulating the rates of decomposition (Gartner and Cardon, 2004). The correlation coefficient between a decomposition period and initial nitrogen were found to have a negative correlation (r = –0.929). Contrary to this, a relation between the decomposition period and initial lignin content showed a significant strong positive correlation (r = 0.954), while the concentration of initial cellulose showed a non-significant strong positive correlation (r = 0.897) with the decomposition period (Table 7). A higher nitrogen content promotes decomposition, which has a suppressing effect due to the impedance formed by its presence on lignin degrading enzymes (Sjoberg, 2004). On the other hand, the C/N ratio at the initial month was found to have a non-significant strong positive correlation (r = 0.820) with the decomposition period. The C/N ratio of initial leaf litter was observed to be a good predictor of litter decomposition and nutrient release (Sandhu et al., 1990). Likewise, the lignin/N ratio showed a significant strong positive correlation (0.969) between the initial lignin/N ratio and decomposition period. Contrary to this, a negative relation between the initial lignin/N ratio and decay period (r = –0.473) was recorded in subtropical forests of China (Yang et al., 2004).
Table 7.
Coefficient of correlation (r) between litter decomposition period and litter chemistry at the initial period in four study species
| Species | Total decompo-sition period, months | Initial total nitrogen, % | Initial lignin, % | Initial cellulose,% | C/N | Lignin/N | Correlation coefficient (r) | ||||
|---|---|---|---|---|---|---|---|---|---|---|---|
| Decom-position period vs initial total N |
Decom-position period vs initial lignin | Decom-position period vs initial cellulose | Decom-position period vs C/N | Decom-position period vs lignin/N | |||||||
| Pongamia pinnata (Species-I) |
10 | 1.93 | 13.78 | 7.52 | 23.33 | 7.14 | –0.929ns | 0.954* | 0.897 ns | 0.820ns | 0.969* |
| Terminalia arjuna (Species-II) |
10 | 2.03 | 14.13 | 6.14 | 23.34 | 6.90 | |||||
| Gardenia resinifera (Species-III) |
11 | 1.84 | 18.48 | 10.76 | 23.23 | 10.04 | |||||
| Celtis
phillipensis (Species-IV) |
13 | 1.72 | 21.18 | 12.11 | 23.66 | 12.31 | |||||
* Correlation was significant at p < 0.05% level; ns: non-significant. Source: www.statskingdom.com.
Nutrient release during the decomposition period. The values of organic carbon, water soluble compounds, and C/N ratio of leaf litter decreased subsequently during decomposition. On the other hand, the total nitrogen, lignin, cellulose, and lignin/N ratio increased linearly during decomposition after a sharp decline at the initial decomposition period (Table 8). Alexander (1977) reported that the carbon compounds are the readily available energy source for decomposers. The concentration of nitrogen in the decomposing litter increased in the course of decomposition. Release of nutrients depends not only on litter composition, but also on soil type, microbial communities, and soil properties (Kutsch and Dilly, 1999). The correlation between litter mass loss and chemical composition of the decomposing litter were analyzed by ANOVA (p < 0.05 and p < 0.01) and shown in Table 9.
Table 8.
Concentration (%) of organic carbon, total nitrogen, lignin, water-soluble compounds and C/ N ratio in the decomposing leaf litter of different species during a different season
| Seasons | Mar. 2018– Feb. 2019 | Chemical composition (%) | ||||||
|---|---|---|---|---|---|---|---|---|
| Organic carbon | Total nitrogen | Lignin | Cellulose | WSC | C/N | L/N | ||
| Pongamia pinnata (Species-I) | ||||||||
| Summer | Apr | 40.81 ± 0.65 | 1.68 ± 0.02 | 14.55 ± 0.57 | 8.77 ± 0.35 | 5.52 ± 0.15 | 24.29 | 8.66 |
| Rainy | Jun | 37.58 ± 0.34 | 1.75 ± 0.04 | 15.20 ± 0.35 | 10.07 ± 0.19 | 5.79 ± 0.33 | 21.47 | 8.69 |
| Aug | 35.84 ± 0.82 | 1.86 ± 0.06 | 15.86 ± 0.66 | 13.24 ± 0.22 | 4.66 ± 0.28 | 19.27 | 8.53 | |
| Oct | 34.22 ± 0.26 | 1.89 ± 0.03 | 16.32 ± 0.40 | 13.15 ± 0.45 | 3.73 ± 0.29 | 18.11 | 8.63 | |
| Winter | Dec | 32.63 ± 0.66 | 1.90 ± 0.02 | 18.65 ± 0.82 | 15.95 ± 0.38 | 3.40 ± 0.12 | 17.17 | 9.82 |
| Feb 2019 | – | – | – | – | – | – | – | |
| Terminalia arjuna (Species-II) | ||||||||
| Summer | Apr | 43.87 ± 0.88 | 1.72 ± 0.02 | 14.78 ± 0.34 | 6.65 ± 1.43 | 5.66 ± 0.12 | 25.51 | 8.59 |
| Rainy | Jun | 38.83 ± 0.72 | 1.81 ± 0.04 | 16.47 ± 0.63 | 8.22 ± 0.56 | 4.95 ± 0.31 | 21.45 | 9.10 |
| Aug | 38.17 ± 0.76 | 1.93 ± 0.01 | 17.22 ± 0.55 | 11.61 ± 1.15 | 4.23 ± 0.17 | 19.78 | 8.92 | |
| Oct | 36.99 ± 0.63 | 1.96 ± 0.02 | 17.81 ± 0.26 | 13.04 ± 0.78 | 4.50 ± 0.43 | 18.87 | 9.09 | |
| Winter | Dec | 36.14 ± 1.08 | 1.96 ± 0.03 | 20.24 ± 0.41 | 14.10 ± 0.26 | 4.58 ± 0.18 | 18.44 | 10.33 |
| Feb 2019 | – | – | – | – | – | – | – | |
| Gardenia resinifera (Species-III) | ||||||||
| Summer | Apr | 38.76 ± 0.75 | 1.65 ± 0.02 | 18.93 ± 0.26 | 11.37 ± 0.35 | 4.81 ± 0.04 | 23.49 | 11.47 |
| Rainy | Jun | 36.61 ± 0.23 | 1.77 ± 0.05 | 19.65 ± 0.38 | 14.23 ± 0.80 | 4.68 ± 0.28 | 20.68 | 11.10 |
| Aug | 35.90 ± 0.46 | 1.80 ± 0.03 | 20.38 ± 1.10 | 16.89 ± 0.21 | 4.23 ± 0.15 | 19.94 | 11.32 | |
| Oct | 33.37 ± 0.42 | 1.85 ± 0.01 | 21.62 ± 0.65 | 17.34 ± 0.45 | 4.01 ± 0.20 | 18.04 | 11.69 | |
| Winter | Dec | 32.03 ± 0.87 | 1.89 ± 0.02 | 24.07 ± 0.93 | 19.08 ± 0.39 | 3.93 ± 0.33 | 16.95 | 12.74 |
| Feb 2019 | – | – | – | – | – | – | – | |
| Celtis phillipensis (Species-IV) | ||||||||
| Summer | Apr | 36.41 ± 0.42 | 1.69 ± 0.01 | 23.26 ± 0.42 | 15.93 ± 0.35 | 6.49 ± 0.33 | 21.54 | 13.76 |
| Rainy | Jun | 34.88 ± 0.26 | 1.71 ± 0.03 | 24.37 ± 0.30 | 18.35 ± 0.26 | 6.14 ± 0.76 | 20.40 | 14.25 |
| Aug | 34.53 ± 0.27 | 1.73 ± 0.05 | 24.69 ± 0.83 | 20.67 ± 0.45 | 5.55 ± 0.30 | 19.96 | 14.27 | |
| Oct | 32.69 ± 0.11 | 1.75 ± 0.05 | 25.10 ± 0.18 | 20.95 ± 0.80 | 5.27 ± 0.09 | 18.68 | 14.34 | |
| Winter | Dec | 30.15 ± 0.65 | 1.78 ± 0.04 | 26.48 ± 0.37 | 21.63 ± 0.77 | 4.89 ± 0.13 | 16.94 | 14.88 |
| Feb 2019 | 29.34 ± 0.52 | 1.80 ± 0.02 | 30.54 ± 0.48 | 23.80 ± 0.84 | 4.83 ± 0.08 | 16.30 | 16.97 | |
Table 9.
Coefficient of correlation (r) between litter mass loss (%) and leaf litter chemistry at decomposing period in four study species
| Species | Chemical composition, % | ||||||
|---|---|---|---|---|---|---|---|
| Organic carbon | Total nitrogen | Lignin | Cellulose | WSC | C/N | L/N | |
| Pongamia pinnata | –0.974* | 0.945ns | –0.926** | –0.939* | –0.960* | –0.963** | 0.990** |
| Terminalia arjuna | –0.878ns | 0.924ns | –0.939* | –0.968* | –0.716ns | –0.899ns | 0.996** |
| Gardenia resinifera | –0.988** | 0.950* | –0.960** | –0.958** | –0.976** | –0.973** | 0.954** |
| Celtis phillipensis | –0.968** | 0.983** | –0.843* | –0.948* | –0.984** | –0.976** | 0.942** |
Source: www.statskingdom.com. * Correlation was significant at the level of p < 0.05%; ** Correlation was significant at p < 0.01% level; ns: non-significant.
The nitrogen availability is essential for litter decomposition, as an increased soil N value can cause change in the soil nutrient level and decomposers as well as the quality of decomposing litter (Liu et al., 2017). According to this study, the relation between the total nitrogen concentration and lignin/N ratio of decomposing leaf litter strongly positively correlated (r = 0.924 to 0.983 and r = 0.942 to 0.996) with litter mass loss of all four species. Similarly, the nitrogen concentration of decomposing leaf litter strongly positively correlated (r = 0.924 to 0.983) with litter mass loss of all four species (Devi and Yadava, 2010). Nitrogen concentration positively correlated (r = 0.738) and showed a positive relation with N content in various studies (Devi, 2002; Das and Das, 2010; Jamaludheen and Kumar, 1999; Sarkar et al. (2016). However, the chemical composition of organic carbon, lignin, cellulose, water soluble compounds, and C/N ratio of decomposing leaf litter showed a slightly negative correlation with litter mass loss in all species. The relation between lignin, cellulose, and mass rate of leaf litter from hard woods and other species is strongly negative. It is known that lignin and cellulose can control the decomposition rate through its own resistance to enzymatic attack and by physically interfering with decay of other chemical fractions of cell walls (Alexander, 1977; Bisht et al., 2014; Sarkar et al., 2016). This study assessed the standard permissible limit and clearly expressed that the highest N concentration and lowest C/N ratio exhibited the highest decay rate among all four species.
Though, the results of ANOVA highlighted that the decomposing leaf litter chemistry was found to exhibit significant differences (p < 0.05 and p < 0.01) in all the study species. In contrast, Pongamia pinnata exhibited non-significant total nitrogen values. Also, the chemical composition of organic carbon, total nitrogen, WSC, and C/N ratio were non-significant in Terminalia arjuna.
Coefficient of correlation between litter mass loss (%) and abiotic variables
To analyze the effect certain environmental factors have on litter mass loss in the four study species, abiotic variables such as temperature, rainfall, rainy days, relative humidity, and soil moisture were linked to litter mass loss percent and compared with the results of ANOVA (p < 0.05) in terms of statistics (Table 10). The moisture and temperature are considered vital variables that determine the decomposition rate (Meentemeyer, 1984). The relation between the litter mass loss and rainfall was significant, displaying a highly positive correlation in all the study species (r = 0.998 to 0.999). Such factors as relative humidity (r = 0.711 to 0.785) and soil moisture (r = 0.382 to 0.839) showed a non-significant highly positive correlation to the mass loss in all the species. Likewise, a correlation of soil moisture with residual litter weight is positive (Barbhuiya et al., 2008; Sarkar et al., 2016), which is similar to the present study. Other factors like temperature and rainy days have a non-significant negative correlation with the mass litter loss in all the study species.
Table 10.
Coefficient of correlation (r) between litter mass loss (%) and abiotic variables in the four study species
| Abiotic variables | Pongamia pinnata | Terminalia arjuna | Gardenia resinifera | Celtis phillipensis |
|---|---|---|---|---|
| Percent weight loss vs Temperature | –0.990 ns | –0.983 ns | –0.969 ns | –0.975 ns |
| Percent weight loss vs Rainfall | 0.998* | 0.999* | 0.998* | 0.999* |
| Percent weight loss vs Rainy days | –0.576 ns | –0.538 ns | –0.481 ns | –0.503 ns |
| Percent weight loss vs Relative humidity | 0.711 ns | 0.742 ns | 0.785 ns | 0.769 ns |
| Percent weight loss vs Soil moisture | 0.439 ns | 0.382 ns | 0.736 ns | 0.839 ns |
Source: www.statskingdom.com. * Correlation was significant at the level of p < 0.05%; ns: non-significant.
CONCLUSION
This study helps to determine an annual litter accumulation associated with C and N in each species, which is fundamental in getting an understanding of C and N soil cycles and how they enhance litter decay. N, P, and K are necessary for litter decomposition, as increased litter nitrogen can cause change in the nutrient level of soil and decomposers as well as the quality of decomposing litter. Decomposition constant and nutrient release pattern are species-specific and correlate with quality, including chemical litter composition as well as seasonal and environmental factors of tropical forests in India. This forest type could play a significant role in mitigation in the context of global change. In today’s situation of climate change, being able to recognize the forest litter and decomposition due to anthropogenic disturbances on nutrients cycle is an absolute necessity.
Список литературы
Alexander M. Introduction to Soil Microbiology. 2nd edn. John Wiley and Sons, N.Y., USA. 1977.
Averti I.S., Urielle M.M., Jodrhy M, Parfait MM, Naiving M, Nzingoula S, Stoffenne. Litterfall, Standing Litter and Leaves Decomposition within Urban Tropical Forest of Zoological Park of Brazzaville, Republic of the Congo // Research J. Botany. 2018. V. 13(1). P. 1–10.
Barbhuiya A.R., Arunachalam A., Nath P.C., Khan M.L., Arunachalam K. Leaf litter decomposition of dominant tree species of Namdapha National Park, Arunachal Pradesh, northeast India // J. Forest Research. 2008. V. 13(1). P. 25–34.
Bijayalaxmi D.N., Yadava P.S. Influence of climate and litter quality on litter decomposition and nutrient release in sub-tropical forest of Northeast India // J. Forestry Research. 2010. V. 21(2). P. 143–150.
Bisht V.K., Nautiyal B.P., Kuniyal C.P., Prasad P., Sundriyal R.C. Litter Production, Decomposition and Nutrient Release in Subalpine Forest Communities of the Northwest Himalaya // J. Ecosystems. 2014. P. 1–13.
Black C.A. Methods of Soil Analysis, Part. I, Am. Soc. Agron., Madison, Wisconsin, USA. 1965.
Chapman S.K., Koch G.W. What type of diversity yields synergy during mixed litter decomposition in a natural forest ecosystem? // Plant and Soil. 2007. V. 299. P. 153–1262.
Chaubey O.P., Prasad R., Mishra G.P. 1988. Litter production and nutrient return in teak plantations and adjoining natural forests in Madhya Pradesh // J. Tropical Forestry. 1988. V. 4. P. 242–255.
Chave J., Navarrete D., Almeida S., Alvarez E., Arag L., Bonal D., Chatelet P., Silva- Espejo J.E., Goret J.Y., Hildebrand P., Jimenez E., Patino S., Penuela M.C., Philips O.L., Stevenson P., Malhi Y. Regional and seasonal patterns of litterfall in tropical South America // Biogeosciences. 2010. V. 7. P. 43–55.
Clark D.A., Brown S., Kicklighter D.W., Chambers J.Q., Thomlinson J.R. Measuring net production in forests: concepts and field methods // Ecological Applications. 2001. V. 11. P. 356–370.
Cortina J., Vallejo R. Effects of clearfelling on forest floor accumulation and litter decomposition in a radiata pine plantation // Forest Ecology and Management. 1994. V. 70. P. 299–310.
Das A.K., Ramakrishnan P.S. Litter dynamics in Khasi pine of northeast India // Forest Ecology and Management. 1985. V. 10. P. 135–153.
Das T., Das A.K. Litter production and decomposition in the forested areas of traditional homegardens: a case study from Barak Valley, Assam, northeast India // Agroforestry Systems. 2010. V. 79(2). P. 157–170.
Dent D., Bagchi R., Robinson D., Majalap N., Burslem D. Nutrient fluxes via litter fall and leaf litter decomposition vary across a gradient of soil nutrient supply in a lowland tropical rain forest // Plant Soil. 2006. V. 288. P. 197–215.
Devi A.S. Litter Decomposition and Nutrient Mineralisation in Dry Tropical Deciduous Forest of Manipur. Ph. D. Thesis. Manipur University, Imphal. 2002.
Devi N.B., Yadava P.S. Influence of climate and litter quality on litter decomposition and nutrient release in sub-tropical forest of Northeast India // J. Forestry Research. 2010. V. 21(2). P. 143–150.
Do Q.D., Angkawijaya A.E., Tran-Nguyen P.L., Huynh L.H., Soetaredjo F.E., Ismadji S., Ju Y.H. Effect of extraction solvent on total phenol content, total flavonoid content, and antioxidant activity of Limnophila aromatica // J. Food and Drug Analysis. 2014. V. 22(3). P. 296–302.
Facelli J.M., Pickett S.T.A. Plant litter: Its dynamics and effects on plant community structure // The Botanical Review. 1991. V. 57. P. 1–32.
Feng C., Wang Z., Ma Y., Fu S., Chen H.Y. Increased litterfall contributes to carbon and nitrogen accumulation following cessation of anthropogenic disturbances in degraded forests // Forest Ecology and Management. 2019. V. 432. P. 832–839.
Gartner T.B., Cardon Z.G. Decomposition dynamics in mixed-species leaf litter a review // Oikos. 2004. V. 104. P. 230.
Gei M.G., Powers J.S. Nutrient cycling in tropical dry forests in tropical dry forests in the Americas // Ecology, Conservation, and Management. Eds G.A. Sanchez-Azofeifa, J.S. Powers, G.W. Fernandes, M. Quesada. Boca Raton, FL: CRC Press), 2014. P. 141–155.
Giebelmann U.C., Martins K.G., Brandle M., Schadler M., Marques R., Brandl R. Lack of home-field advantage in the decomposition of leaf litter in the Atlantic rainforest of Brazil // Applied Soil Ecology. 2013. V. 8. P. 1–6.
Giweta M. Role of litter production and its decomposition and factors affecting the processes in a tropical forest ecosystem: a review // J. Ecology and Environment. 2020. V. 44(11). P. 1–9.
Goering H.D., Van Soest P.J. Forage Fibre Analysis. US Dept. of Agriculture, Agricultural Research Service, Washington DC. 1975.
Goma-Tchimbakala J., Ndoundou-Hockemba M., Kokolo A., Mboussou-Kimbangou A.N.S. Variations in litter production and nutrient supply in plantations of limba (Terminalia superba) in Congo // Tropiculture. 2005. V. 23. P. 53–59.
Gonzalez G., Ley R.E., Schmidt S.K., Zou X., Seastedt T.R. Soil ecological interactions: comparison between tropical and subalpine forests // Oecologia. 2001. V. 128. P. 549–556.
Gonzalez I., Sixto H., Soalleiro R.R., Oliveira N., Robinia L. Nutrient Contribution of Litterfall in a Short Rotation Plantation of Pure or Mixed Plots of Populus alba L. and Robinia pseudoacacia L. // Forests. 2020. V. 11(11). P. 1–19.
Gosz J.R., Likens G.E., Bormann F.H. Organic matter and nutrient dynamics of the forests and forest floor in the Hubbard Brook Forest // Oecologia (Berlin). 1976. V. 22. P. 305–320.
Hossain M.Z., Okubo A., Sugiyama S. Effects of grassland species on decomposition of litter and soil microbial communities // Ecological Research. 2010. V. 25. P. 255–261.
Hou D., Guo K., He W., Liu C., Qiao X. Litter accumulation alters the abiotic environment and drives community successional changes in two fenced grasslands in Inner Mongolia // Ecology and Evolution. 2019. V. 9. P. 9214–9224.
Hyvarinen A. Deposition on forest soil: effects of tree canopy on throughfall // Acidification in Fineland. Eds. E. Karuppi, P. Anttila, K. Kentamies. Berlin, Heidelberg, Germany: Springer-Verlag, 1990. P. 199–213.
Ifo S.A. Carbon contributions on the ground and stocks in two forest types (forest gallery and secondary forest) of the Bateke Plateaux. Brazzaville: Faculty of Science, University of Marien Ngouabi. 2010.
Jackson M.L. Soil Chemical Analysis. Prentice Hall of India Private Ltd., New Delhi. 1958.
Jamaludheen V., Kumar B.M. Litter of multipurpose trees in Kerala, India: variations in the amount, quality, decay rates and release of nutrients // Forest of Ecology and Management. 1999. V. 115(1). P. 1–11.
Jaryan V., Uniyal S.K., Gupta R.C., Singh R.D. Litter fall and its decomposition in Sapium sebiferum: an invasive tree species in Western Himalaya // International J. Ecology. 2014. P. 1–7.
Jenny H., Gessel S.P., Bingham F.T. Comparative study of decomposition rates of organic matter in temperate and tropical regions // Soil Science. 1949. V. 68. P. 419–432.
Jensen K., Gutekunst K. Effects of litter on establishment of grassland plant species: the role of seed size and successional status // Basic and Applied Ecology. 2003. V. 4. P. 579–587.
Kavvadias V.A., Alifragis D., Tsiontsis A. Litterfall, litter accumulation and litter decomposition rates in four forest ecosystems in northern Greece // Forest Ecology and Management. 2001. V. 144. P. 113–127.
Kumar B.M., Deepu J.K. Litter production and decomposition dynamics in moist deciduous forests of the Western Ghats in Penninsular India // Forest Ecology and Management. 1992. V. 50(3). P. 181–201.
Kurz C., Couteaux M.M., Thiery J.M. Residence time and decomposition rate of Pinus pinaster needles in a forest floor from direct field measurements under a Mediterranean climate // Soil Biology and Biochemistry. 2000. V. 3. P.1197–1206.
Kutsch W.L., Dilly O. Ecophysiology of plant and microbial interactions in terrestrial ecosystems // Beyschlag, W., Steinlein, T. (eds.) Okophysiologie Pflanzlicher Interaktionen. Bielefelder Okologische Beiträge. 1999. B. 14. S. 74–84.
Lawrence D. Regional-scale variation in litter production and seasonality in the tropical dry forests of southern Mexico // Biotropica. 2005. V. 37. P. 561–570.
Liu J., Wu J., Su H., Gao Z., Wu Z. Effects of grazing exclusion in XilinGol grassland differ between regions // Ecological Engineering. 2017. V. 99. P. 271–281.
Liu L. Patterns of litterfall and nutrient return at different altitudes in evergreen hardwood forests of Central Taiwan // Annals Forest Science. 2012. V. 69(8). P. 877–886.
Meentemeyer V. The geography of organic decomposition rates // Annals of the Association of American Geographers. 1984. V. 74(4). P. 551–560.
Moretto A.S., Distel R.B., Didone N.G. Decomposition and nutrient dynamic of leaf litter and roots from palatable and unpalatable grasses in a semi-arid grassland // Applied Soil Ecology. 2001. V. 18(1). P. 31–37.
Mudrick D.A., Hoosein M., Hicks R.R., Townsend E.C. Decomposition of leaf litter in an Appalachian forest: effects of leaf species, aspect, slope position and time // Forest Ecology and Management. 1994. V. 68. P. 231–250.
Naeth M.A., Bailey A.W., Chanasyk D.S., Pluth D.J. Water holding capacity of litter and soil organic matter in mixed prairie and fescue grassland ecosystems of Alberta // J. Range Management. 1991. V. 44. P. 13–17.
Olsen S.R., Cole C.V., Watanable F.S., Dean L.A. Estimation of available phosphorus in soils by extraction with sodium bicarbonate // U.S. Department of Agriculture. 1954. V. 939. P. 1–19.
Olson J.S. Energy storage and the balance of producers and decomposers in ecological systems // Ecology. 1963. V. 44. P. 322–331.
Pandey U., Singh J.S. A quantitative study of the forest floor, litterfall and nutrient return in an oak-conifer forest in Himalaya. I. Composition and dynamics of forest floor // Acta Oecologia (Oecologia Generalis). 1981. V. 2. P. 83–99.
Pascal J.P. Evergreen forests of the Western Ghats: Structural and functional trends. // K.P. Singh and J.S. Singh (eds.). Tropical Ecosystems: Ecology and Management. New Delhi: Wiley Eastern Ltd., 1992. P. 385–408.
Patricio M.S., Nunes L.F., Pereira E.L. Litterfall and litter decomposition in chestnut high forest stands in northern Portugal // Forest Systems. 2012. V. 21(2). P. 259–271.
Piper G.S. Soil and Plant Analysis. The University of Adelaide, Australia. 1950.
Portillo-Estrada M., Pihlatie M., Korhonen J.F.J., Levula J., Frumau A., Ibrom A., Lembrechts J.J., Morillas L., Horváth L., Jones S., Niinemets Ü. Climatic controls on leaf litter decomposition across European forests and grasslands revealed by reciprocal litter transplantation experiments // Biogeosciences. 2016. V. 13. P. 1621–1633.
Qiulu X.Z., Xie S.C., Liu W.Y. Studies on the forest ecosystem in Allao Mountains, Yunnan, China. Kumming: Science and Technology Press. 1998.
Quideau S.A., Graham R.C., Oh S.W., Hendrix P.F., Wasylishen R.E. Leaf litter decomposition in a chaparral ecosystem, southern California // Soil Biology and Biochemistry. 2005. V. 37(11). P. 1988–1998.
Rani S., Benbi D.K., Rajasekaran A., Chauhan S.K. Litterfall, decomposition and nutrient release patterns of different tree species in TaranTaran district of Punjab, India // J. Applied and Natural Science. 2016. V. 8(3). P. 1260–1266.
Regina I.S. Litterfall, decomposition and nutrient release in three semi-arid forests of the Duero basin, Spain // Forestry. 2001. V. 74. P. 347–358.
Ruan H., Li Y., Zou X. Soil communities and plant litter decomposition as influenced by forest debris: Variation across tropical riparian and upland sites // Pedobiologia. 2005. V. 49(6). P. 529–538.
Saha S., Rajwar G.S., Kumar M., Uupadhaya K. Litter production, decomposition and nutrient release of woody tree species in Dhanaulti region of temperate forest in Garhwal Himalaya // Eurasian J. Forest Science. 2016. V. 4(1). P. 17–30.
Sarkar M., Devi A., Nath M. Foliar litter decomposition of four Hollongapar Gibbon Wildlife Sanctuary, Assam, North East India // Current Science. 2016. V. 111(4). P. 747–753.
Sandhu J., Sinha M., Ambasht R.S. Nitrogen release from decomposing litters of Leucaena leucocephala in the dry tropics // Soil Biology and Biochemistry. 1990. V. 22. P. 859–863.
Sjoberg L. Principles of risk perception applied to gene technology // Science and Society. 2004. V. 5(1). P. 47–51.
Snell F.D., Snell C.T. Colorimetric Methods and Analysis. V. 116, 3rd edn. New Delhi: Van North and Co. Inc., 1949.
Spain A.V. Litterfall and the standing crop of litter in three tropical Australian rain forests // J. Ecology. 1984. V. 72. P. 947–961.
Sundarapandian S.M., Swamy P.S. Litter production and leaf-litter decomposition of selected tree species in tropical forests at Kodayar in the Western Ghats, India // Forest Ecology and Management. 1999. V. 123(2). P. 231–244.
Swift M.J., Heal O.W., Anderson J.M. Decomposition in Terrestrial Ecosystems. Oxford: Blackwell Scientific Publications, 1979.
Tripathi O.P., Pandey H.N., Tripathi R.S. Litter production, decomposition and physic- chemical properties of soil in 3 developed agroforestry systems of Meghalaya, Northeast India // African J. Plant Science. 2009. V. 3(8). P. 160–170.
Uma M., Rajendran K. Growth, litterfall and litter decomposition of Casuarina equisetifolia in a semiarid zone // J Tropical Forest Science. 2014. V. 26(1). P. 125–133.
Updegraff D.M. Semimicro determination of cellulose in biological materials // Analytical Biochemistry. 1969. V. 32. P. 420–424.
Vogt K.A., Grier C.C., Vogt D.J. Production, turnover, and nutrient dynamics of above- and belowground detritus of world forests // Advances in Ecological Research. 1986. V. 15. P. 303–377.
Wang X., Xu Z., Lu X., Wang R., Cai J., Yang S., Jiang Y. Responses of litter decomposition and nutrient release rate to water and nitrogen addition differed among three plant species dominated in a semi-arid grassland // Plant and Soil. 2017. V. 418. P. 241–253.
Wang Q., Wang S., Huang Y. Comparisons of litterfall, litter decomposition and nutrient return in a monoculture Cunninghamia lanceolata and a mixed stand in Southern China // Forest Ecology and Management. 2008. V. 255. P. 1210–1218.
Yang W.Q., Wang K.Y., Kellomaki S., Xiao L. Wet canopy evaporation rate of three stands in Western Sichuan, China // J. Mountain Science. 2004. V. 1. P. 166–174.
Zeng Q.C., An S.S., Liu Y. Soil bacterial community response to vegetation succession after fencing in the grassland of China // Science of the Total Environment. 2017. V. 609. P. 2–10.
Zhang H., Yuan W., Liu S. Seasonal patterns of litterfall in forest ecosystem worldwide // Ecological Complexity. 2014. V. 20. P. 240–270.
Дополнительные материалы отсутствуют.