

Геоморфология и палеогеография, 2022, T. 53, № 3, стр. 107-116
ИЗМЕНЧИВОСТЬ СТРОЕНИЯ И СОСТАВА ВЕРХНЕЧЕТВЕРТИЧНЫХ ЛЁССОВ ПРЕДКАВКАЗЬЯ (ЮГ ЕВРОПЕЙСКОЙ ЧАСТИ РОССИИ)
Е. А. Константинов 1, *, Е. А. Мазнева 1, Н. В. Сычев 1, А. Л. Захаров 1, К. Г. Филиппова 1
1 Институт географии РАН
Москва, Россия
* E-mail: eakonst@igras.ru
Поступила в редакцию 30.03.2022
После доработки 10.04.2022
Принята к публикации 15.04.2022
- EDN: RLXLUS
- DOI: 10.31857/S0435428122030075
Аннотация
Источники и направления переноса минеральной пыли, из которой сложена лёссово-палеопочвенная серия (ЛПС) Предкавказья, остаются предметами дискуссии в региональной палеогеографии. Одним из основных подходов в решении указанных проблем является пространственный анализ строения и состава лёссовых отложений. На основе исследования кернов трех опорных скважин был построен субширотный разрез плакорных ЛПС позднего плейстоцена и голоцена. Обнаружено направленное уменьшение мощности ЛПС и размера частиц с востока на запад. Так, в колонке OT-20 (восток региона) суммарная мощность верхнего плейстоцена и голоцена составляет 22.6 м, в колонке SB-1 (центр региона) – 9.7 м, в колонке YS-1 (запад региона) – 5.3 м. Среднее содержание песчаной фракции в осадке: OT-20 – 17.1%, SB-1 – 6.1%, YS-1 – 1.9%. Полученные результаты указывают на то, что главное направление эолового переноса в позднем плейстоцене и голоцене было ориентировано с востока на запад. А песчаные пустыни Прикаспийской низменности, вероятно, являлись основным источником минеральной пыли – областью дефляции. Второстепенными источниками минеральной пыли могли служить локальные песчаные массивы, расположенные на террасах крупных рек – таких как Дон и Кубань. Изменения механического состава осадка по глубине показывают, что интенсивность эоловых процессов была выше в холодные эпохи и ниже – в теплые. ЛПС на востоке региона, в силу высоких темпов аккумуляции минеральной пыли, имеют значительно более высокое временное разрешение палеоклиматической и палеоландшафтной записи по сравнению с ЛПС на западе. В восточных лёссах выше амплитуда изменчивости состава осадка, что говорит о более высокой чувствительности осадконакопления к изменениям условий.
1. INTRODUCTION
Loess-paleosol sequences (LPSs) are the main information source for the Pleistocene paleogeographic conditions reconstructing at the south of the East European Plain. There are the thickest (up to 140 m (Lessovyi…, 2001)) and one of the most complete LPSs of Europe, whose age may exceed 800 ka, in the Ciscaucasia. Despite the long history of studying the LPSs of the Ciscaucasia, there is still no exhaustive explanation of the origin of such a high thickness. Also, questions about the sources of loess material and the main directions of aeolian transport for individual stages of the Quaternary period have not been fully resolved (Fedorovich, 1960; Balaev, Tsarev, 1964; Rozycki, 1991; Sazhin et al., 2012; 2013; Költringer, 2021; 2022). Mainly, these questions were associated with the lack of a reasonable and generally accepted chronostratigraphic scheme for the LPSs of Ciscaucasia. This fact prevented reliable correlations between sections and boreholes and did not allow to correlate the stratigraphic positions with global paleoclimatic scales.
A geochronological background for the Upper Pleistocene LPS of the Eastern Azov region has been obtained in recent years. A series of OSL and 14C dates (Velichko et al., 2017; Chen et al., 2018a; 2018b; Mazneva et al., 2021; Chen et al., 2022) confirmed and detailed of the stratigraphic scheme developed by A.A. Velichko (Velichko et al., 2011; Velichko, Morozova, 2015). According to investigations (Velichko et al., 2012; Konstantinov et al., 2018) LPSs on the interfluve areas have stratigraphic consistency, and paleosols have stable features. So, it is possible to recognize paleosols in sections and cores by a set of specific morphological features.
This paper attempts to apply the update of Velichko scheme (Mazneva et al., 2021; Chen et al., 2022) for the Late Quaternary LPS of the entire Ciscaucasian region. The study results of boreholes from Eastern Azov to the Terek-Kuma plain made it possible to carry out a paleosols correlation with the stratigraphic scheme and construct a general sublatitudinal section of the LPS there. The particle size composition, magnetic susceptibility and carbonates content of sediments were determined. The analysis of the thickness and particle size composition variability of synchronous horizons along the sublatitudinal section aims to identify the sources of loess material and reconstruct the main directions of aeolian transport in the Ciscaucasia in the Late Pleistocene and Holocene.
2. MATERIALS AND METHODS
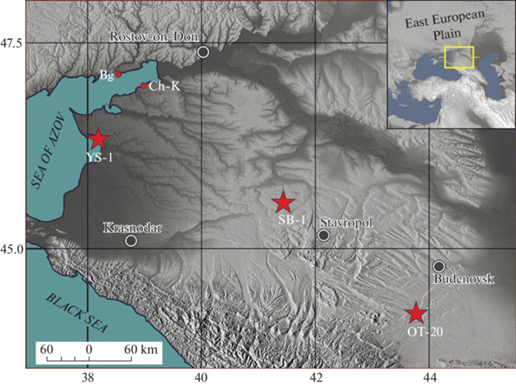
Fieldwork was carried out in 2017–2020 as part of the Institute of Geography, Russian Academy of Sciences (Moscow) expeditions. Boreholes revealed the structure of the loess cover in three key sites along the sublatitudinal profile (fig. 1): 1) Yasinskaya, borehole YS-1, 46.37894° N, 38.13761° E, H a.s.l. = 18 m, Azov-Kuban lowland; 2) Sladkaya Balka, borehole SB-1, 45.53210° N, 41.45172° E, H a.s.l. = 154 m, western macroslope of the Stavropol Upland; 3) Otkaz-noe, borehole OT-20: 44.34696° N, 43.87704° E, Terek-Kuma plain, H a.s.l. = 234 m.
Fig. 1.
Study area. Red stars mark the boreholes used in this study. Red circles mark the discussed loess sections.
Рис. 1. Район работ. Красные звездочки показывают положение скважин, красные кружки – обсуждаемые ЛПС.
All the boreholes were drilled on subhorizontal flat interfluves without traces of modern (ravines, potholes) and relict (hollows) linear erosion to obtain the loess paleoarchives with the undamaged conditions. This allowed minimizing the impact of erosion and/or slope redeposition of the material.
We combined the methods by (Chen et al., 2020; Sprafke, 2020) for the sample preparation for particle size analysis. The dry sample was ground (without destroying the mineral particles) to a homogeneous powder. Average samples weighing 0.3 grams were taken from the powder and placed in test tubes. The samples were sequentially treated with 10% HCl (1 h) and 37% H2O2 (6 h with heating to 90°C) to dissolve carbonates and organic matter. Further, the material in test tubes was stirred for 12 h on an overhead shaker in the presence of 4% Na4P2O7 solution. Grain size analysis was performed by the laser diffraction method on a Malvern Mastersizer 3000 analyzer. After adding the sample to the HydroEV disperser unit, the material was sonicated with a power of 70% for 100 seconds. Seven repeated measurements were performed after the ultrasound switched off and then averaged in the Mastersizer v.3.62 App. The particle size was calculated using the Mie theory, with the values of the refractive index of the dispersant n = 1.33, the particles n = 1.55 and the absorption coefficient k = 0.1 (Ozer et al., 2010).
An approximate estimate of the carbonate content (${\text{CO}}_{3}^{{( - 2)}}$) was made using the weight loss on ignition (LOI) method. The difference between LOI 950°C and LOI 550°C characterizes the loss of CO2 from carbonates (Heiri et al., 2001). The carbonate content was found by multiplying this value by a coefficient of 1.36 (Bengtsson, Enell, 1986).
Massic magnetic susceptibility (χ) was measured using a ZH Instruments 150L magnetic susceptibility meter. Samples with a volume of 8–12 ml were dried for 24 hours at a temperature of 40°C, rubbed to a fraction <2.0 mm and weighed (Maher, 1998). Then, the samples, placed in plastic weighing cups, were immersed in the measuring cuvette of the device. The measurement was performed at a field strength of 320 A/m and a frequency of 500 Hz. 4 measurements were made for each sample. The final value of MS was calculated by finding the average.
During the drilling, samples from the OT-20 borehole were taken using a steel sampler with an internal diameter of 35 mm and a length of 30 cm. This is the reason for the large vertical sampling interval (30 cm). After removing the drill from the borehole, the samples were put from the sampler into an opaque plastic bag (under dark conditions).
The dating of samples was carried out in the laboratory of optically stimulated luminescence, Karpinsky Russian Geological Research Institute VSEGEI (St. Petersburg, Russia). All samples were prepared for measurements, including sieving, treatment with 10% HCl, 10% H2O2 and 10% HF. Quartz and feldspar grains were separated using a heavy liquid with a density of 2.58 g/cm3. Concentrated HF then treated quartz fraction to remove the feldspar contamination. Due to the fine grain composition of the sediments, fractions of 63–90 and 90–180 μm were selected, the obtained K-feldspars were limited to 3 aliquots. All measurements were made on multi-grain aliquots (quartz, 8 mm diameter; feldspar, 2 mm) mounted on stainless steel discs (quartz) or stainless steel cups (feldspar), and measured in a Risø TL/OSL reader, model DA-20 C/D, equipped with a calibrated beta source. Quartz purity was confirmed by the absence of a significant infrared-stimulated luminescence (IRSL) signal. Quartz dose estimates were made following a standard SAR protocol (Murray, Wintle, 2000; 2003) using blue light stimulation at 125°C for 40 s with a 260°C preheat for 10 s, a 220°C cut heat and an elevated temperature (280°C) blue-light stimulation at the end of each SAR cycle. K-feldspar dose estimates were measured using the post-IR IRSL SAR procedure (Thiel et al., 2011), adopting preheats of 320°C for 60 s (following regeneration doses) and 310°C for 60 s (test doses). After preheating, the aliquots were stimulated at 50°C with IR for 200 s (IR50 signal) and subsequently stimulated again at 290°C with IR for 200 s (post-IR RSL290 signal, pIRIR290). No correction was made for possible pIRIR290 (Thiel et al., 2011) or IR50 signal instability. Radio-nuclide concentrations were measured using a low-background gamma-ray spectrometer based on a pure germanium crystal CANBERRA BE3825.
3. RESULTS
3.1. YS-1. During the field lithological description of the YS-1 core (depth 5.3 m), the following layers were identified:
1. 0.0–0.3 m. Dark gray silt loam, enriched with humus, granular structure, crumbly, plant roots, sharp low boundary (Ap horizon of modern soil).
2. 0.3–0.9 m. Dark gray silt loam, enriched with humus, granular structure, plant roots, gradual low boundary. (A horizon of Holocene soil).
3. 0.9–1.95 m. Gradual change of color from dar-kish gray to light yellow-gray, clay loam, soft carbo-nate nodules, dispersed carbonates in a matrix, gra-dual low boundary (Bk horizon of Holocene soil).
4. 1.95–2.95 m. Gray-brown clay loam, dispersed carbonates in a matrix, gradual low boundary (weakly-developed paleosol).
5. 2.95–3.2 m. Gray-yellow clay loam, dispersed carbonates in a matrix, gradual low boundary (loess).
6. 3.2–4.0 m. Gray-brown clay loam, gradual darkening towards the bottom of the layer, dispersed carbonates in a matrix, gradual low boundary (weakly-developed paleosol).
7. 4.0–4.4 m. Darkish brown clay loam, enriched with humus, dark streaks and spots of humus, gradual low boundary (A horizon of paleosol).
8. 4.4–5.3 m. Dark gray-brown clay loam, enriched with humus, granular structure, dark streaks and spots of humus, dispersed gypsum and carbonates in a matrix, rare small carbonate nodules, sharp low boundary (A horizon of paleosol with carbonates and gypsum horizons overlay).
The granulometric composition of sediments in the YS-1 core is characterized by a very fine particle size (fig. 2) and high homogeneity in depth (fig. 3). The median grain size (MGS) varies from 6.6 to 9.6 µm. The silt fraction (4–63 μm) prevails; its content varies from 65.3 to 77.7%, the average value is 71.4%. The clay fraction (<4 µm) content ranges from 21.4 to 33.0%, with an average value of 26.7%. Clay content has a weak upward trend in depth. The maximum values of clay are observed at a depth of 0.0–1.0 m, and the minimum values are observed at a depth of 4.4–4.2 m. The sand fraction (>63 μm) content varies from 0.7 to 3.7%; the average value is 1.9%. The sand fraction content reaches its maximum values at a depth of 1.0–2.0 m; the minimum values are associated with the soil layers at depth intervals of 0.0–1.0 m and 4.2–4.4.
Fig. 2.
Scatterplots with main composition variables: (a) – sand (>63 μm) vs clay (<4 μm); (b) – silt (4–63 μm) vs clay (<4 μm); (c) – median grain size (MGS) vs carbonates (${\text{CO}}_{3}^{{( - 2)}}$); (d) –median grain size (MGS) vs magnetic susceptibility (χ).
Рис. 2. Диаграммы рассеяния по парам основных характеристик состава осадка: (a) – песок (>63 μm) и глина (<4 μm); (b) – алеврит (4–63 μm) и глина (<4 μm); (c) – медианный размер частиц (MGS) и содержание карбоната (${\text{CO}}_{3}^{{( - 2)}}$); (d) – медианный размер частиц (MGS) и магнитная восприимчивость (χ).
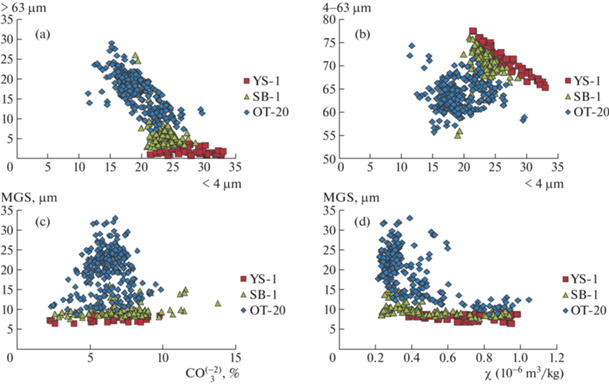
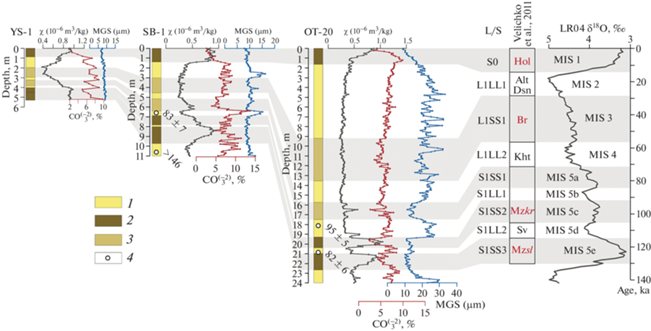
Fig. 3.
Sublatitudinal cross-section of loess-paleosoil sequences of the Upper Pleistocene and Holocene. OSL dates of SB-1 are from Mazneva et al. (2021). Other data is original. Subdivisions of scheme of Velichko et al. (2011): Hol – Holocene soil, Alt –Altynovo loess, Dsn – Desna loess, Br – Bryansk paleosol, Kht – Khotylevo loess, Mzkr – Krutitsa paleosol (upper phase of Mezin pedocomplex), Sv – Sevsk loess, Mzsl – Salyn paleosol (lower phase of Mezin pedocomplex). L/S – modern modification of Velichko scheme (Mazneva et al., 2021; Chen et al., 2022). Figure captions: 1 – loess, 2 – well-developed soil, 3 – weakly developed soil, 4 – OSL dates (ka).
Рис. 3. Субширотный разрез лёссово-палеопочвенной серии позднего плейстоцена и голоцена. OSL-даты для скважины SB-1 даны по (Mazneva et al., 2021). Стратиграфия – по А.А. Величко (2011): Hol – голоценовая почва, Alt – алтыновский лёсс, Dsn – деснинский лёсс, Br – брянская палеопочва, Kht – хотылевский лёсс, Mzkr – крутицкая палеопочва (верхняя часть мезинского педокомплекса), Sv – севский лёсс, Mzsl – салынская палеопочва (нижняя часть мезинского педокомплекса). L/S – современная модификация схемы А.А. Величко (Mazneva et al., 2021; Chen et al., 2022). Условные обозначения: 1 – лёсс; почвы: 2 – хорошо развитые, 3 – слабо развитые; 4 – OSL-даты (тыс. лет).
χ varies from 0.38 to 0.98 × 10⁻⁶ m3/kg, the average value is 0.72 × 10⁻⁶ m3/kg (fig. 2 and 3). High values of χ (> 0.8 × 10⁻⁶ m3/kg) are associated with well-developed soil layers. The maximum values of χ are observed at a depth of 4.2 m. The minimum values of χ are observed at depths of 1.9 and 2.6 m.
The carbonates content varies from 2.2 to 9.7%, with an average value of 6.3%. High values of carbonates (7.0–9.7%) characterizes illuvial soil horizons: 1.0, 1.8–2.0, 2.8–3.2, 4.0, 5.2 m. Low values (<6%) are typical for humus horizons of soils: 0.0–0.8, 1.2–1.6, 2.2–2.6, 3.4–3.6, 4.2–5.0 m.
3.2. SB-1. The sediment structure in core SB-1 is described in detail in Mazneva et al. (2021). Here we will consider only the upper 11 meters of the core, associated with the Upper Pleistocene and Holocene. Analytical characteristics were obtained by methods other than (Mazneva et al., 2021). Therefore, it will be analyzed in detail.
The sediment in core SB-1 has a silty-clayey composition with significant variations of the sand with depth (figs. 2 and 3). MGS varies from 7.8 to 16.3 µm. The silt fraction dominates; its content varies from 54.9 to 76.2%, the average value is 70.6%. The clay content ranges from 18.9 to 28.6%, with an average value of 23.3%. Clay content does not trend with depth. High values of clay content (>25%) are observed in the following intervals: 0.0–1.5, 3.4–3.7, 4.8–4.9, 6.0–6.4, 7.3–8.0 m.
Low values of clay content (<22%) are observed in the following intervals: 2.4–3.0, 6.5–6.9. The sand content varies from 2.8 to 26.1%; the average value is 6.1%. The sand content reaches high values (>7%) in the following intervals: 2.2–3.0, 3.9–5.4, 6.2–6.9, 9.0–9.5, 10.6–11.0 m. Low sand content (<5%) is usually associated with soil layers: 0.0–1.8 m, 3.0–3.8, 5.7–6.1, 7.0–8.3, 9.5–9.9 m.
χ varies from 0.24 to 0.94 × 10⁻⁶ m3/kg, the average value is 0.5 × 10⁻⁶ m3/kg. High values of χ (>0.45 × × 10–6 m3/kg) are associated with the soil layers: 0.0–1.5, 5.8–6.3, 6.9–9.9 m. The maximum values of χ are observed at a depth of 0.3 m and 8.4 m. Low values of χ (<0.35 × 10⁻⁶ m3/kg) are associated with “pure” loess with a weak pedogenesis process: 2.0–5.1, 6.4–6.8 m.
The carbonates content varies from 2.6 to 13.7%, with an average value of 7.0%. High values of carbo-nates (>7.0%) characterize eluvial soil horizons: 1.5–3.8, 6.2–6.8, 7.1–8.2, 8.8–9.3, 9.7–10.3 m. Low values of carbonates content (<6.5%) characterize the humus horizons of soils: 0.0–1.4, 5.0–6.1, 7.5–8.7, 9.4–9.8 m.
3.3. OT-20. During the field lithological description of the OT-20 core (depth 24.0 m), the following layers were identified:
1. 0.0–1.0 m. Dark brown silt loam, enriched with humus, granular structure, plant roots, gradual low boundary (Holocene soil horizon).
2. 1.0–1.6 m. Gradual change of color from darkish brown to light yellow-gray, silt loam, soft carbonate nodules, dispersed carbonates in a matrix, gradual low boundary (Holocene soil Bk horizon).
3. 1.6–9.0 m. Gray-yellow sandy loam, homogeneous, massive, rare dispersed carbonates in a matrix, gradual low boundary (pure loess).
4. 9.0–12.0 m. Gray-yellow darkish sandy loam, less sand than in the overlying layer, rare dispersed carbonates in a matrix in the bottom of layer (weak-developed paleosol).
5. 12.0–15.7 m. Gray-yellow sandy loam, homogeneous, massive, rare dispersed carbonates in a matrix, gradual low boundary (sandy loess).
6. 15.7–17.4 m. Gray-yellow darkish sandy loam, less sand than in the overlying layer, rare dispersed carbonates in a matrix in the bottom of layer (weak-developed paleosol).
7. 17.4–19.3 m. Gray-yellow sandy loam, homogeneous, massive, rare dispersed carbonates in a matrix, gradual low boundary (pure loess).
8. 19.3–20.4 m. Brown silt loam, enriched with humus, dispersed carbonates in a matrix, gradual low boundary (paleosol horizon).
9. 20.4–21.0 m. Gradual change of color from brown to light yellow-gray, silt loam, soft carbonate nodules, dispersed carbonates in a matrix, gradual low boundary (paleosol Bk horizon).
10. 21.0–22.0 m. Dark gray-brown silt loam, enriched with humus, granular structure, dispersed carbonates in a matrix, gradual low boundary (paleosol horizon).
11. 22.0–24.0 m. Gradual change of color from gray-brown to light yellow-gray, silt loam, soft carbonate nodules, dispersed carbonates in a matrix, gradual low boundary (paleosol Bk horizon).
The sediments in the OT-20 column have sandy loam composition with significant variations of sand and clay in depth. MGS varies from 8.9 to 33.2 µm. The silt fraction prevails; its content varies from 55.7 to 74.3%, the average value is 63.5%. The clay faction content ranges from 11.4 to 29.7%, with an average value of 19.4%. Increased values of clay content (>20%) are associated with the soil layers: 0.0–2.7, 9.2–9.9, 10.9–12.7, 15.9–17.5, 19.4–23.3 m. Low values of clay content (<18%) are observed in loess intervals: 2.8–10.6, 16.5–15.6, 17.7–19.4, 23.2–24.0 m. The sand fraction content varies from 7.2 to 29.2%; the average value is 17.1%. The sand content reaches high values (>16%) in the following layers: 1.3–15.3, 17.4–19.1, 23.4–24.0 m. Reduced sand content (<16%) are associated with the soil layers: 0.0–1.3, 15.3–17.4, 19.1–23.4 m.
χ varies from 0.24 to 1.05 × 10⁻⁶ m3/kg, the average value is 0.39 × 10⁻⁶ m3/kg. High values of χ (>0.45 × 10⁻⁶ m3/kg) are associated with well-deve-loped soils: 0.0–1.5, 19.0–20.4, 21.0–22.6 m. The maximum values of χ are observed at a depth of 0.0, 19.8, and 21.4 m. Weakly expressed paleosols are marked with a slight increase in χ. In the intervals of 10.5–13.9 m and 15.9–17.4 m, the values of χ exceed 0.3 × 10⁻⁶ m3/kg. Low values of χ (<0.3 × 10⁻⁶ m3/kg) are associated with “pure” loess with a weak pedogenesis process.
The carbonates content varies from 2.3 to 9.8%, with an average value of 6.2%. High values of carbo-nates (>7.0%) characterize eluvial soil horizons: 0.4–2.8, 17.4–17.9, 20.2–20.9, 22.2–23.9 m. Low va-lues of carbonates content (<5%) characterize the humus horizons of soils: 0.0–0.3, 9.3–12.1, 15.5–16.5, 19.4–20.1, 21.0–21.8 m.
3.4. OSL-dating. Luminescence dates were obtained for two samples from the OT-20 column (OT/18.1–18.4 and OT/20.8–21.1). The correct age could not be obtained from quartz (table 1). The Quartz dose–response curve showed that the saturation limit was exceeded. The feldspar dates are finite: the upper sample is 95 ± 5 ka, the lower sample is 82 ± 6 ka. The observed inversion is likely related to the small number of aliquots and the small sample size (<100 grams) that was used to determine the dose rate. The composition of the sediment and its aeolian ge-nesis give high confidence in the good bleaching of particles during transport and sedimentation.
Table 1.
Results of luminescence dating of OT-20 core samples. Dates were obtained at the Laboratory of optically stimulated luminescence, Karpinsky Russian Geological Research Institute VSEGEI (St. Petersburg, Russia) Таблица 1. Результаты ОСЛ-датирования образцов из скважины OT-20. Даты получены в Лаборатории оптически стимулированной люминесценции ВСЕГЕИ (Санкт-Петербург, Россия)
| Lab. No. | Sample name | Mineral | Water content, % | Grain size, µm | Number of aliquots | U, ppm | Th, ppm | K, % | Dose rate, Gy/ka | De, Gy | Age, ka |
|---|---|---|---|---|---|---|---|---|---|---|---|
| RGI-0189 | OT/18.1–18.4 | Q | 21 | 63–90 | 3 | 6.5 ± 1.8 | 12.3 ± 0.3 | 2.5 ± 0.1 | 3.8 ± 0.2 | >165 | >43 |
| Fs | 63–90 | 3 | 4.3 ± 0.2 | 411 ± 11 | 95 ± 5 | ||||||
| RGI-0184 | OT/20.8–21.1 | Q | 27 | 90–180 | 3 | 7.7 ± 2.1 | 13.3 ± 0.4 | 2.9 ± 0.1 | 3.9 ± 0.2 | >105 | >27 |
| Fs | 90–180 | 3 | 4.7 ± 0.3 | 382 ± 9 | 82 ± 6 |
4. DISCUSSION
We conducted a stratigraphic subdivision of the cores based on the lithological description of cores and variations in grain size, magnetic susceptibility, and carbonates content. Horizons of pure loess, weakly-developed soils, and well-developed soils were identified. The sequence of paleosols and their morphologi-cal properties, together with luminescent dating, give us a basement to correlation with the Velichko scheme (Velichko et al., 2011) and its modern modification (Mazneva et al., 2021; Chen et al., 2022).
The analysis of the study results reveals a clear trend of the Upper Pleistocene – Holocene LPS thickness and the average particle size decreasing in the direction from SE to NW. The total thickness of the Upper Pleistocene and Holocene deposits in the OT-20 section is 22.6 m, SB-1 – 9.7 m, YS-1 – 5.3 m (fig. 3). Moreover, the thickness drop does not occur linearly; the rate of decline decreases from the OT-20 site to the NW. The average content of the sand fraction decreases in the same direction: OT-20 – 17.1%, SB-1 – 6.1%, YS-1 – 1.9%. The average content of clay fraction, on the contrary, increases from SE to NW: OT-20 – 19.4%, SB-1 – 23.3%, YS-1 – 26.7.
Similar patterns showing the correlation between the thickness and the particle size composition of the loess and the remoteness of the source were first identified in Illinois, USA (Smith, 1942). Many loess research in North America (Lewis et al., 1975; Mason, 2001; Bettis et al., 2003; Muhs et al., 2003) reconstructed the atmospheric circulation using this me-thod. This method is also appropriate for the Chinese Loess Plateau (Liu, 1985; Porter, 2001) and loesses of Western Europe (Rozycki, 1991; Rousseau et al., 2014).
The main source of aeolian dust composing the loess of the Ciscaucasia is localized in the east, where the sandy massifs of the Caspian lowland are located. And the dominant direction of aerosol flow in the Late Pleistocene and Holocene was from the east to the west. Similar conclusions were previously reached by B.A. Fedorovich (1960) and L.G. Balaev and P.V. Tsarev (1964). They relied on the regularities of the spatial distribution of heavy fraction minerals in loess (Balaev, Tsarev, 1964) and on observations of modern aeolian processes (Fedorovich, 1960) in the deserts of Central Asia and Ciscaucasia.
Modern data from the central and eastern Ciscaucasia meteorological stations show the predominance of eastern winds in the winter season and western ones in the summer. As demonstrated by A.N. Sazhin et al. (2012, 2013), “the strongest winds in the region are observed at the end of winter and early spring, when the east wind speed reaches storm and hurricane force (29–34 m/s and more)” (Sazhin et al., 2012, p. 12). Also, data on the direction of modern dust storms and dune morphology indicate the predominance of dust transport from the east (Mazneva et al., 2021).
However, the Beglitsa section (“Bg” on the map – fig. 1), located in the Northern Sea of Azov, stands out from the general trend of hypothetical dust transport (from east to west). Beglitsa has anomalously high thicknesses of the Upper Pleistocene and Holocene LPS for the Azov region (10 m in total). Also, Beglitsa LPS has an anomalously high sand content: up to a maximum of 30%, the average content is about 10%. Other Azov section of Chumbur-Kosa section (“Ch-K” on the map – fig. 1) is very similar in composition and thickness to the YS-1 core. The other example of anomaly is the high sand concentration which observed in the SB-1 core at a depth of 2.1–3.0 above the L1SS1 soil. These anomalies are not consistent with the hypothesis of a single common source of mineral dust. Probably, a significant contribution to sedimentation is made by local sources. The local sources are sandy massifs on the terraces of large rivers – the Don and Kuban (Mazneva et al., 2021). Moreover, in the past, the areas of sandy massifs could be larger. This hypothesis is consistent with the results (Költringer et al., 2022).
The intensity of sediment supply at certain stages of the Late Pleistocene and Holocene was not the same. The differences in the thickness and granulometric composition of loess and paleosol horizons indicate this. The cold stages correspond to the horizons of re-latively thick loess, where, as a rule, the content of sand increases. The warm stages correspond to less thick soil levels, where the proportion of sand is reduced. These differences between soils and loesses increase from west to east, which characterizes sedimentation in the east of the region as generally less stable. Also, this shows a higher paleoclimatic information content of loess-soil paleoarchives in the east of Ciscaucasia.
The intensity of aeolian processes increase during the cryochrones was probably caused by the general aridization of the climate. The role of westerly transport decreases with the activity of the Asian anticyclone increase, which provides stable and strong easterly winds. The increase in the rate of loess accumulation at certain stages could also be associated with regressions of the Caspian Sea level, when huge massifs of loose sandy-clay substrate, easily accessible for deflation, were released. One of the indirect indicators of the influence of the Caspian Sea transgressive-regressive cycles (Yanina, 2014) on the balance of loess accumulation in Ciscaucasia can be the high variabi-lity of sand fraction content in OT-20 core. It is pro-bably caused by the fluctuation of the Caspian Sea, but this statement needs more evidence.
5. CONCLUSION
1. The main source of aeolian dust entering the territory of Ciscaucasia was located in the east – the de-serts of the Caspian lowland. The direction of the surface flow of aerosols from the east to the west dominated throughout the entire Upper Pleistocene and Holocene.
2. Secondary sources of aeolian dust were the local sandy massifs on the terraces of large rivers (Don, Kuban).
3. The intensity of the mineral dust flux was higher during the cold stages and lower during the warm ones.
4. The following factors may have increased mineral dust flux in the past: 1) climate aridization and increased area of sources during cold stages; 2) an increase in the intensity and average annual duration of easterly winds during cold stages (the growing influence of the Asian anticyclone); 3) exposure of vast areas of the former seabed with loose substrate easily accessible for deflation, which was caused by regressions of the Caspian Sea at certain stages of the last glaciation.
4. Loess paleoarchives located in the east of Ciscaucasia (for example, Otkaznoye) better reflect the dynamics of climate change in the region than the western ones because of higher temporal resolution, higher sensitivity (reaction) of paleoindicators to climatic fluctuations. This is expressed in a high amplitude of fluctuations in the granulometric composition, magnetic susceptibility and carbonate content.
5. The sedimentation conditions in the west of Ciscaucasia were more stable (homogeneous) throughout the Upper Pleistocene and Holocene than in the east of the region.
Список литературы
Balaev L.G. and Tsarev P.V. Lessovidnye porody Tsentral’nogo i Vostochnogo Predkavkaz’ya (Loess deposits of Central and Eastern Ciscaucasia). M.: Nauka (Publ.), 1964. 246 p. (in Russ.)
Bengtsson L. and Enell M. Chemical analysis. In: Handbook of Holocene Palaeoecology and Palaeohydrology. Berglund B.E. (Ed.). Chichester: John Wiley & Sons Ltd, 1986. P. 423–451.
Bettis III E.A., Muhs D.R., Roberts H.M., and Wintle A.G. Last Glacial loess in the conterminous USA. Quaternary Science Reviews. 2003. Vol. 22. P. 1907–1946. https://doi.org/10.1016/S0277-3791(03)00169-0
Chen J., Yang T., Matishov G.G., Velichko A.A., Zeng B., He Y., Shi P., Fan Z., Titov V.V., Borisova O.K., Timireva S.N., Konstantinov E.A., Kononov Y.M., Kurbanov R.N., Panin P.G., and Chubarov I.G. A luminescence dating study of loess deposits from the Beglitsa section in the Sea of Azov, Russia. Quaternary International. 2018a. Vol. 478. P. 27–37. https://doi.org/10.1016/j.quaint.2017.11.017
Chen J., Yang T., Matishov G.G., Velichko A.A., Zeng B., He Y., and Shi P. Luminescence chronology and age model application for the upper part of the Chumbur-Kosa loess sequence in the Sea of Azov, Russia. Journal of Mountain Science. 2018b. Vol. 15. P. 504–518. https://doi.org/10.1007/s11629-017-4689-0
Chen J., Yang T., Qiang M., Matishov G.G., Velichko A.A., Zeng B., and Shi P. Interpretation of sedimentary subpopulations extracted from grain size distributions in loess deposits at the Sea of Azov, Russia. Aeolian Research. 2020. Vol. 45. 100597. https://doi.org/10.1016/j.aeolia.2020.100597
Chen J., Stevens T., Yang T., Qiang M., Matishov G., Konstantinov E., Kurbanov R., Zeng B., and Shi P. Revi-siting Late Pleistocene Loess–Paleosol Sequences in the Azov Sea Region of Russia: Chronostratigraphy and Paleoenvironmental Record. Frontiers in Earth Scien-ces. 2022. Vol. 9. 808157. https://doi.org/10.3389/feart.2021.808157
Fedorovich B.A. Voprosy proiskhozhdeniya lessa v svyazi s usloviyami ego rasprostraneniya v Evrazii (Questions about the loess deposits origin in connection with the conditions of its distribution in Eurasia). Trudy Instituta Geografii AN SSSR. 1960. Vol. 80. P. 96–117. (in Russ.)
Heiri O., Lotter A.F., and Lemcke G. Loss on ignition as a method for estimating organic and carbonate content in sediments: reproducibility and comparability of results. Journal of Paleolimnology. 2001. Vol. 25. P. 101–110. https://doi.org/10.1023/A:1008119611481
Költringer C., Bradák B., Stevens T., Almqvist B., Banak A., Lindner M., and Snowball I. Palaeoenvironmental implications from Lower Volga loess – Joint magnetic fabric and multi-proxy analyses. Quaternary Science Reviews. 2021. Vol. 267. 107057. https://doi.org/10.1016/j.quascirev.2021.107057
Költringer C., Stevens T., Lindner M., Baykal Y., Ghafarpour A., Khormali F., and Kurbanov R. Quaternary sediment sources and loess transport pathways in the Black Sea-Caspian Sea region identified by detrital zircon U-Pb geochronology. Global and Planetary Change. 2022. 103736. https://doi.org/10.1016/j.gloplacha.2022.103736
Konstantinov E.A., Velichko A.A., Kurbanov R.N., and Zakharov A.L. Middle to Late Pleistocene topography evolution of the North-Eastern Azov region. Quaternary International. 2018. Vol. 465. P. 72–84. https://doi.org/10.1016/j.quaint.2016.04.014
Lessovyi pokrov Zemli i ego svoistva (Loess cover of the Earth and its properties). V.T. Trophimov (Ed.). M.: MSU (Publ.), 2001. 464 p. (in Russ.)
Lewis G.C., Fosberg M.A., McDole R.E., and Chugg J.C. Distribution and some properties of loess in south-cent-ral and south-eastern Idaho. Soil Science Society of America Proceedings. 1975. Vol. 39. P. 1165–1168. https://doi.org/10.1016/S0277-3791(03)00169-0
Liu D.S. Loess and Environment. Beijing: Science Press (Publ.), 1985. P. 228–250.
Maher B.A. Magnetic properties of modern soils and Quaternary loessic paleosols: paleoclimatic implications. Palaeogeography, Palaeoclimatology, Palaeoecology. 1998. Vol. 137. No. 1–2. P. 25–54. https://doi.org/10.1016/S0031-0182(97)00103-X
Mason J.A. Transport direction of Peoria loess in Nebraska and implications for loess sources on the central Great Plains. Quaternary Research. 2001. Vol. 56. P. 79–86. https://doi.org/10.1006/qres.2001.2250
Mazneva E., Konstantinov E., Zakharov A., Sychev N., Tkach N., Kurbanov R., Sedaeva K., and Murray A. Middle and Late Pleistocene loess of the Western Ciscaucasia: Stratigraphy, lithology and composition. Quaternary International. 2021. Vol. 590. P. 146–163. https://doi.org/10.1016/j.quaint.2020.11.039
Muhs D.R., Ager T.A., Bettis III E.A., McGeehin J., Been J.M., Beget J.E., Pavich M.J., Stafford Jr. T.W., and Stevens D.A.S.P. Stratigraphy and palaeoclimatic significance of Late Quaternary loess-palaeosol sequences of the Last Interglacial – Glacial cycle in cent-ral Alaska. Quaternary Science Reviews. 2003. Vol. 22. No. 18–19. P. 1947–1986. https://doi.org/10.1016/S0277-3791(03)00167-7
Murray A.S. and Wintle A.G. Luminescence dating of quartz using an improved single-aliquot regenerative-dose protocol. Radiation Measurements. 2000. Vol. 32. No. 1. P. 57–73. https://doi.org/10.1016/S1350-4487(99)00253-X
Murray A.S. and Wintle A.G. The single aliquot regenerative dose protocol: potential for improvements in reliability. Radiation Measurements. 2003. Vol. 37. P. 377–381. https://doi.org/10.1016/S1350-4487(03)00053-2
Ozer M., Orhan M., and Isik N.S. Effect of particle optical properties on size distribution of soils obtained by laser diffraction. Environmental & Engineering Geoscience. 2010. Vol. 16. No. 2. P. 163–173. https://doi.org/10.2113/gseegeosci.16.2.163
Porter C. Chinese loess record of monsoon climate during the last glacial-interglacial cycle. Earth–Science Reviews. 2001. Vol. 54. No. 1–3. P. 115–128. https://doi.org/10.1016/S0012-8252(01)00043-5
Rousseau D.-D., Chauvel C., Sima A., Hatté C., Lagroix F., Antoine P., Balkanski Y., Fuchs M., Mellett C., Kageyama M., Ramstein G., and Lang A. European glacial dust deposits: Geochemical constraints on atmospheric dust cycle modeling. Geophysical Research Letters. 2014. Vol. 41. No. 21. P. 7666–7674. https://doi.org/10.1002/2014GL061382
Rozycki S.Z. Loess and Loess-Like Deposits. Wroclaw: Ossolineum-Polish Academy of Sciences. 1991. 187 p.
Sazhin A.N., Vasiliev Yu.I., Chichagov V.P., and Larionov G.A. Eolovyi morfogenez i sovremennyi klimat Evrazii (Katastroficheskie eolovye protsessy, dinamicheskie razlichiya eolovykh protsessov sovremennoy i lednikovykh epokh) (Aeolian morphogenesis and modern climate of Eurasia (Catastrophic aeolian processes, dynamic differences between aeolian processes of the modern era and ice ages)). Geomorphologiya. 2013. Vol. 2. P. 2–15. (in Russ.). https://doi.org/10.15356/0435-4281-2013-2-3-14.
Sazhin A.N., Vasiliev Yu.I., Chichagov V.P., and Lario-nov G.A. Sovremennyi klimat Evrazii (Dinamika atmosfery, blokiruushchie i eolovye protsessy) (Modern climate of Eurasia (Atmospheric dynamics, blocking and eolian processes)). Geomorphologiya. 2012. Vol. 3. P. 10–20. (in Russ.). https://doi.org/10.15356/0435-4281-2012-3-10-20.
Smith G.D. Illinois loess – Variations in its properties and distribution. University of Illinois Agricultural Experiment Station Bulletin. 1942. Vol. 490. P. 139–184.
Sprafke T., Schulte P., Meyer-Heintze S., Händel M., Einwögerer T., Simon U., and Terhorst B. Paleoenvironments from robust loess stratigraphy using high-resolution color and grain-size data of the last glacial Krems-Wachtberg record (NE Austria). Quaternary Science Reviews. 2020. Vol. 248. 106602. https://doi.org/10.1016/j.quascirev.2020.106602
Thiel C., Buylaert J.-P., Murray A., Terhorst B., Hofer I., Tsukamoto S., and Frechen M. Luminescence dating of the stratzing loess profile (Austria) – testing the potential of an elevated temperature post-IR IRSL protocol. Quaternary International. 2011. Vol. 234. P. 23–31. https://doi.org/10.1016/j.quaint.2010.05.018
Velichko A., Morozova T.D., Borisova O.K., Timireva S.N., Semenov V.V., Kononov Yu.M., and Kurbanov R.N. Development of the steppe zone in southern Russia based on the reconstruction from the loess-soil formation in the Don-Azov Region. Doklady Earth Sciences. 2012. Vol. 445. P. 999–1002. https://doi.org/10.1134/S1028334X12080107
Velichko A.A., Faustova M.A., Pisareva V.V., Gribchenko Y.N., Sudakova N.G., and Lavrentiev N.V. Glaciations of the East European Plain. In: Glaciations of the East European Plain: Distribution and Chronology, Developments in Quaternary Sciences. Amsterdam: Elsevier, 2011. P. 337–359.
Velichko A.A. and Morozova T.D. The main features of soil formation in the Pleistocene on the East European Plain and its paleogeographic interpretation. In: Evolution of soils and soil cover. Theory, diversity of natural evolution and anthropogenic soil transformations. V.N. Kudeyarov, I.V. Ivanov (Eds.). M.: GEOS (Publ.), 2015. P. 321–337. (in Russ.)
Velichko A.A., Yang T., Alekseev A.O., Borisova O.K., Kalinin P.I., Konishchev V.N., Kononov Yu.M., Konstantinov E.A., Kurbanov R.N., Panin P.G., Rogov V.V., Sarana V.A., Timireva S.N., and Chubarov I.G. Sravnitelnyi analiz izmenenii uslovii osadkonakopleniya za poslednii mezhlednikovo-lednikovyi makrotsikl v les-sovykh oblastyakh yuga Vostochno-Evropeiskoi ravniny (Priazovie) i tsentral’nogo Kitaya (Lessovoe plato) (Comparative analysis of changes in sedimentation conditions for the last interglacial-glacial macrocycle in the loess areas of the south of the East European Plain (Azov region) and central China (Loess Plateau)). Geomorphologiya. 2017. Vol. 1. P. 3–18. (in Russ.). https://doi.org/10.15356/0435-4281-2017-1-3-18.
Yanina T.A. The Ponto-Caspian region: environmental consequences of climate change during the Late Pleistocene. Quaternary International. 2014. Vol. 345. P. 88–99. https://doi.org/10.1016/j.quaint.2014.01.045
Дополнительные материалы отсутствуют.
Инструменты
Геоморфология и палеогеография