

Микология и фитопатология, 2022, T. 56, № 2, стр. 105-113
Investigation of Cotton Wilt Resistance by Fluorescence Spectroscopy
I. G. Akhmedzhanov 1, *, M. M. Khotamov 2, **
1 Institute of Biophysics and Biochemistry at the National University of Uzbekistan
100047 Tashkent, Uzbekistan
2 Institute of Genetics and Plant Experimental Biology of the Academy of Sciences of the Republic of Uzbekistan
111208 Tashkent Region, Uzbekistan
* E-mail: iskakhm@mail.ru
** E-mail: mansurhatamov@mail.ru
Поступила в редакцию 16.09.2021
После доработки 11.11.2021
Принята к публикации 23.12.2021
- EDN: HTEWII
- DOI: 10.31857/S0026364822020039
Аннотация
A comparative study of the influence of infection with the causative agent of Verticillium wilt on the fluorescence of leaves of cotton genotypes differing in wilt resistance was carried out. It was found that infection of plants of susceptible and medium-resistant genotypes leads to a change in the position of the maxima of the spectra of laser-induced chlorophyll fluorescence and the ratio of fluorescence intensities at 690 and 730 nm. The analysis of spectral changes showed that the main criterion for assessing the degree of wilt resistance of cotton genotypes is the shift in the maxima of the low-temperature spectra of laser-induced chlorophyll fluorescence to the short-wavelength side. Genotypes characterized by a change in the position of the spectral maxima by 7–10 nm are susceptible, up to 5 nm are moderate resistant and in the case of absence of shifts are resistant.
INTRODUCTION
Phytopathogenic organisms cause enormous damage to plant growing, among which the causative agent of cotton wilt disease, the fungus Verticillium dahliae Kleb., occupies a special place. The creation and selection of cotton cultivars resistant to Verticillium wilt is undoubtedly a topical area of research in the field of cotton growing. At the same time, an integral part of these studies should be concerned with the development of reliable and highly effective methods for the rapid diagnosis of wilt resistance of cotton genotypes.
Currently, to determine the resistance of cotton to Verticillium wilt, in addition to traditional methods of phenological observation of infected plants, a method for studying the effectiveness of the hypersensitivity reaction of infected plant tissues is used, the main indicator of which is the intensity of synthesis of fungitoxic substances of phenolic nature, phytoalexins as well as a method for measuring activity enzymes involved in the protective reactions against wilt of cotton plants (Avazkhodzhaev, Zeltser, 1980; Avazkhodzhaev et al., 1995).
At the same time, in the study of plant disease resistance, the method of chlorophyll fluorescence induction is widely used (Belasque et al., 2008; Rai, 2008; Mandal et al., 2009; Pascual et al., 2010; Yi Fang et al., 2015; Martinez-Ferri et al., 2016; Babar et al., 2018; Yan et al., 2018; Aleynikov, Mineev, 2019; Chávez-Arias et al., 2019), since chlorophyll in photosynthetic membranes serves as a kind of a natural sensor of the state of cells of algae and higher plants in changing environmental conditions (Korneev, 2002; Matorin, Rubin, 2012; Goltsev et al., 2014). In this case, fluorimeters of various designs are used (Posudin et al., 2010; Romanov et al., 2010; Akhmedzhanov et al., 2013; Ptushenko et al., 2014; Akinshina et al., 2016), including installations using the laser fluorescence method control of the state of plants and testing their resistance to stressful influences of the external environment (Agishev et al., 2002; Tartachnyk et al., 2006; Belov et al., 2015; Fedotov et al., 2016). In addition, a comparative study of the fluorescence of leaves of diseased and healthy plants reveals signs of the disease caused by damage to the pigment apparatus already at the early stages of the development of the disease (Kshirsagar et al., 2001; Babar et al., 2018; Kuckenberg et al., 2009; Mandal et al., 2009; Yi Fang et al., 2015; Matorin et al., 2018).
Earlier, by measuring the parameters of chlorophyll fluorescence induction, it was found that the infection of plants of the susceptible cotton cultivar C-4727 with the causative agent of Verticillium wilt leads to changes in the fluorescence spectra and its kinetics, i.e. to a significant increase in the ratio of fluorescence intensities at 690 and 730 nm and a shift of the spectra by 10 nm to the short wavelength region, as well as a significant decrease in the value of the (FM – FT)/FM parameter (Khotamov et al., 2020). Such drastic changes in the parameters of induced chlorophyll fluorescence may indicate that when cotton is infected with wilt, the native structure of chlorophyll-protein complexes is disturbed, leading to a change in energy migration between the forms of chlorophyll itself and to a disruption in the interaction of two pigment photosystems (PSI and PSII) (Veselovsky, Veselova, 1990; Korneev, 2002). This suggests the possibility of using fluorescent methods to study the resistance of various cotton genotypes to the disease caused by the fungus V. dahliae. Our data showed that the characteristics of fluorescence induction curves can be sufficiently informative for this purpose. However, the change in the position of the maxima of the spectra of laser-induced chlorophyll fluorescence (LICF) and the ratio of fluorescence intensities at 690 and 730 nm under conditions of infection of plants of the susceptible cultivar C-4727 indicate a greater diagnostic efficiency by measuring and analyzing the LICF spectra of cotton leaves (Khotamov et al., 2020).
The aim of the present work was a comparative study of the effect of infection with the causative agent of Verticillium wilt of various cultivars and accessions of the Genetics collection of cotton from the Institute of Genetics and Experimental Biology of Plants of the Academy of Sciences of the Republic of Uzbekistan (IGEBR) on the parameters of the LICF spectra and the development of a method for express diagnostics of cotton wilt resistance on this basis.
MATERIALS AND METHODS
In the experiments, we used plants of cotton accessions (Gossypium hirsutum L.), differing in wilt resistance, from the Genetics collection of the IGEBR, including 6 promising and zoned cultivars of cotton: S-4727, Ibrat, Sulton, Bukhoro-6, Ishonch, Gulbahor-2 and 4 lines: A-1423, A-1428, A-1431, A-1530, which were grown in vessels on sterilized vermiculite enriched with Belousov’s nutrient mixture (Zhurbitsky, 1968). In the phase of 6–7 true leaves, cotton plants were infected with a dosed inoculum of race-2 of the fungus Verticillium dahliae from the collection of phytopathogens of the IGEBR at the rate of 2.5 million spores/ml. Plants served as control, into the stems of which water was introduced using a capillary (Avazkhodjaev et al., 1995).
A monospore culture of V. dahliae was grown for 8 days in test tubes on a solid Czapek’s medium of the following composition: NaNO3 – 3 g; KH2PO4 – 1 g; MgSO4 – 0.5 g; KCl – 0.5 g; FeSO4 – 0.01 g, sucrose – 30 g, agar-agar – 20 g per 1 liter of distilled water. The inoculation was carried out by the “prick” method on the surface of the agar medium. Conidia or microsclerotia of micromycete as well as a mixture of these fungal structures were used as inoculum. Then, using a microbiological loop under sterile conditions, some of the conidia were transferred into Petri dishes with Czapek’s medium, where they were germinated in a thermostat at a temperature of 27°C in complete darkness. A suspension of fungal spores was prepared by shaking 2 ml of sterile distilled water in a test tube with a 10–15 day old fungus culture (Avazkhodzhaev, Zeltser, 1980). The density of fungal spores in suspension was calculated by the method described in (Izrailskiy et al., 1968). The suspension of fungal conidia obtained in a test tube, after calculating its density, was diluted to the required concentration.
Plants were infected by inoculum injection using a triple injection into the stem with a syringe. The inoculum was discharged from the syringe as a drop of suspension at the end of the needle. The needle was inserted into the stem at a 45° angle. The drop was sucked into the stem, and this gave visible confirmation of inoculation. The appearance of chlorosis on the lower leaves of cotton, yellowing of tissues and necrotization of areas of the leaf blade testified to the defeat of infected plants by wilt (Avazkhodjaev, Zeltser, 1980).
When studying the parameters of the hypersensitivity reaction, etiolated hypocotyls of cotton were used. Seedlings were grown in a thermostat at 24°C. The qualitative composition of phytoalexins (FA) was determined by thin layer chromatography on Silufol-UV-254 plates from Kavalier (Czech Republic). For the quantitative determination of isohemigossypol (IHG) and phytoalexin-equivalent (FA-E), cotton seedlings were finely chopped with scissors, filled with chloroform at 1 : 3 ratio, and placed in a refrigerator for 24 hours. Then obtained chloroform extract containing FA was filtered from solid residues and dried with a water jet pump. The dried residue was dissolved in 1 ml of chloroform. The resulting chloroform eluate was used for coating Silufol UV-254 plates. The plates were placed in chromatographic chambers and a single separation was performed in a benzol – methanol (9 : 1) solvent system. Benzol and methanol must be anhydrous because with an admixture of water, the system turns out to be cloudy and unsuitable for analysis. The heat-dried chromatograms were viewed under UV light and developed with fluoroglicin (2% in 96% ethanol). For this, the plate was covered with a developing reagent using a spray gun, then left for several minutes in air to evaporate the solvent, after which the chromatograms were heated for 1 min in a thermostat at 100°C. Phytoalexins IHG and FA-E are stained in a stable dark crimson color. The quantitative determination of FA was carried out by elution of spots from chromatograms with a benzol-methanol mixture (9 : 1) and measurement of the color intensity on a photoelectrocolorimeter with a blue light filter. The eluate from the clean zone of the chromatogram was used as a standard. The quantitative content of IHG was calculated using a pre-drawn calibration graph using pure IHG preparation as a standard. The results obtained were expressed in μg per g of wet tissue of etiolated seedlings. The experiments were carried out 3–4 times.
The induced chlorophyll fluorescence of the leaves of control (uninfected) and plants infected with the causative agent of Verticillium wilt was measured on days 3, 5, 8, and 11 after inoculation. The fluorescence spectra of the leaves were measured on a LIDAR setup (Agishev et al., 2002), the main element base of which is a helium-neon laser emitter, the exciting light wavelength is 632 nm, the radiation power is 100 mW, and the light beam diameter is 1 cm – telescope of the Newton system with a working mirror diameter of 110 mm. Spectral selection of the signal was carried out using the diffraction grating of the MUM monochromator. The laser operation mode, the scanning of the monochromator over the spectrum, and the output of the results to the display are programmatically set. The intensity ratio I690/I730 and the position of the maxima (λm) of the LICF spectra were used as parameters characterizing changes in the fluorescence spectra. LICF measurements were carried out on the 3–4 leaves of the middle layer in 6–10 plants, the distance between which was not less than 10 m. The results were processed by methods of mathematical statistics according to B.A. Dospekhov (1985).
RESULTS
As mentioned above, in the study of cotton wilt resistance, the method for determining the parameters of the hypersensitivity reaction in plant tissues infected with the pathogen is successfully applied (Avazkhodzhaev et al., 1995). This method was applied to determine the resistance of various cultivars, lines and accessions of the Gene collection of cotton of the IGEBR to Verticillium wilt. The revealed differences in the intensity of the synthesis of fungitoxic substances – phenolic compounds of the gossypole series – phytoalexins in the tissues of the studied genotypes of plants infected with the causative agent of Verticillium wilt, allowed them to be divided into 4 groups. Moreover, if the cultivars are assigned to the groups of extremely susceptible, susceptible, moderately resistant and resistant (Khotamov, Akhmedzhanov, 2021), then the accessions and lines of the Gene collection are divided into groups of susceptible, moderately resistant and resistant, including the group of weakly resistant genotypes (Khotamov, Redzhapova, 2019). In order to confirm this statement, the effect of artificial infection with the fungus V. dahliae of zoned cultivars and accessions of the Gene collection of cotton on such parameters of the LICF spectra as the position of their maxima and the ratio of fluorescence intensities at 690 and 730 nm reflecting, as noted above (Khotamov et al., 2020), the physiological state of plants under the influence of biotic environmental factors, was investigated.
Previously, all accessions of cotton gene collection used in the experiments were tested for resistance to Verticillium wilt by determining the effectiveness of the hypersensitivity reaction in pathogen-infected plant tissues. The results of studies of the content of fungitoxic substances – phytoalexins, which are an indicator of the wilt resistance of cotton (Avazkhodzhaev, Zeltser, 1980; Avazkhodzhaev et al., 1995), are shown in Table 1.
Table 1.
The contents of phytoalexins of isohemigossipole (IHG) and phytoalexin equivalent (FA-E) in the tissues of etiolated hypocotyls of sprouts of various genotypes of cotton 48 hours after inoculation of plants with the causative agent of Verticillium wilt
| Cotton cultivars and lines | Phytoalexin content, μg/g raw tissue | |
|---|---|---|
| IHG | FA-E | |
| Ibrat | 0.2 ± 0.07 | 0.2 ± 0.12 |
| S-4727 | 9.3 ± 0.86 | 8.1 ± 0.77 |
| А-1423 | 7.9 ± 0.81 | 7.0 ± 0.65 |
| А-1428 | 7.5 ± 0.92 | 6.4 ± 0.72 |
| Bukhoro-6 | 18.0 ± 1.69 | 14.3 ± 1.55 |
| Sulton | 19.4 ± 1.90 | 15.0 ± 1.64 |
| А-1431 | 19.1 ± 1.83 | 14.7 ± 1.49 |
| Ishonch a | 33.7 ± 3.41 | 22.7 ± 2.52 |
| Gulbahor-2 | 33.9 ± 3.12 | 23.6 ± 2.41 |
| А-1530 | 31.6 ± 3.52 | 21.4 ± 2.01 |
Analysis of the presented data showed that the studied genotypes of cotton can be divided into 3 groups differing in intensity of phytoalexin formation processes. The first group included genotypes, the content of isohemigossipole (IHG) in pathogen-infected tissues of which does not exceed 10 μg/g of raw tissue: Ibrate, S-4727, A-1423, A-1428. The second group consisted of the cultivars Bukhoro-6, Sulton and the line A-1431, which were characterized by twice the content of IHG. To the greatest extent, the hypersensitivity reaction is manifested in infected cotton tissues of the Ishonch and Gulbahor-2 cultivars, as well as the A-1530 line, the total content of phytoalexins in which reaches concentrations that are practically toxic to the pathogen. Thus, the evaluation of different genotypes by using biochemical markers of hypersensitivity of infected cells made it possible to divide the cultivars and lines of cotton studied in the experiment according to the degree of wilt resistance into 3 groups: susceptible, medium-resistant and resistant genotypes.
Table 2 shows the results of a study of the effect of artificial infection of plants of cultivars (Ibrat, S-4727, Bukhara-6, Sulton, Ishonch, Gulbahor-2) and accessions of the gene collection (A-1423, A-1428, A-1431, A-1530), typical representatives of groups cotton genotypes differing in wilt resistance, to the position of the maxima of the fluorescence spectra of leaves measured at room temperature and liquid nitrogen temperature. The data presented in the table showed that cultivars Ibrat, C-4727 and accessions of the gene collection A-1423, A-1428 are characterized by the greatest changes in the position of the maxima of the low-temperature spectra of the LICF of the leaves of plants infected with wilt. Less significant changes in this parameter were recorded in cultivars Bukhara-6, Sulton and accession A-1431, while in cultivars Ishonch, Gulbahor-2 and accessions A-1530 there were no similar changes. In addition, the first two groups of cotton genotypes differed in the timing of fixing the shifts of the spectral maxima.
Table 2.
Influence of artificial infection of plants with the causative agent of Verticillium wilt on the position of the maxima (λm) of the laser-induced chlorophyll fluorescence spectra of leaves of various cotton genotypes
| Cotton cultivars and lines | Spectra measured at temperature | Days after inoculation | |||
|---|---|---|---|---|---|
| 3 | 5 | 8 | 11 | ||
| λм, нм | |||||
| Ibrat сontrol | 20°С | 690, 730 | 690, 730 | 690, 730 | 690, 730 |
| –196°С | 690, 730 | 690, 730 | 690, 730 | 690, 730 | |
| Ibrat infection | 20°С | 690, 730 | 690, 730 | 690, 730 | 690, 730 |
| –196°С | 690, 730 | 690, 725 | 685, 725 | 681, 723 | |
| S-4727 сontrol | 20°С | 690, 730 | 690, 730 | 690, 730 | 690, 730 |
| –196°С | 690, 730 | 690, 730 | 690, 730 | 690, 730 | |
| S-4727 infection | 20°С | 690, 730 | 690, 730 | 690, 730 | 690, 730 |
| –196°С | 690, 730 | 690, 725 | 685, 725 | 681, 723 | |
| Bukhoro-6 сontrol | 20°С | 690, 730 | 690, 730 | 690, 730 | 690, 730 |
| –196°С | 690, 730 | 690, 730 | 690, 730 | 690, 730 | |
| Bukhoro-6 infection | 20°С | 690, 730 | 690, 730 | 690, 730 | 690, 730 |
| –196°С | 690, 730 | 690, 730 | 685, 725 | 685, 725 | |
| Sulton сontrol | 20°С | 690, 730 | 690, 730 | 690, 730 | 690, 730 |
| –196°С | 690, 730 | 690, 730 | 690, 730 | 690, 730 | |
| Sulton infection | 20°С | 690, 730 | 690, 730 | 690, 730 | 690, 730 |
| –196°С | 690, 730 | 690, 730 | 685, 725 | 685, 725 | |
| Ishonch сontrol | 20°С | 690, 730 | 690, 730 | 690, 730 | 690, 730 |
| –196°С | 690, 730 | 690, 730 | 690, 730 | 690, 730 | |
| Ishonch infection | 20°С | 690, 730 | 690, 730 | 690, 730 | 690, 730 |
| –196°С | 690, 730 | 690, 730 | 690, 730 | 690, 730 | |
| Gulbahor-2 сontrol | 20°С | 690, 730 | 690, 730 | 690, 730 | 690, 730 |
| –196°С | 690, 730 | 690, 730 | 690, 730 | 690, 730 | |
| Gulbahor-2 infection | 20°С | 690, 730 | 690, 730 | 690, 730 | 690, 730 |
| –196°С | 690, 730 | 690, 730 | 690, 730 | 690, 730 | |
| А-1423 сontrol | 20°С | 690, 730 | 690, 730 | 690, 730 | 690, 730 |
| –196°С | 690, 730 | 690, 730 | 690, 730 | 690, 730 | |
| А-1423 infection | 20°С | 690, 730 | 690, 730 | 690, 730 | 690, 730 |
| –196°С | 690, 730 | 690, 725 | 685, 725 | 681, 723 | |
| А-1428 сontrol | 20°С | 690, 730 | 690, 730 | 690, 730 | 690, 730 |
| –196°С | 690, 730 | 690, 730 | 690, 730 | 690, 730 | |
| А-1428 infection | 20°С | 690, 730 | 690, 730 | 690, 730 | 690, 730 |
| –196°С | 690, 730 | 690, 725 | 685, 725 | 681, 723 | |
| А-1431 сontrol | 20°С | 690, 730 | 690, 730 | 690, 730 | 690, 730 |
| –196°С | 690, 730 | 690, 730 | 690, 730 | 690, 730 | |
| А-1431 infection | 20°С | 690, 730 | 690, 730 | 690, 730 | 690, 730 |
| –196°С | 690, 730 | 690, 730 | 685, 725 | 685, 725 | |
| А-1530 сontrol | 20°С | 690, 730 | 690, 730 | 690, 730 | 690, 730 |
| –196°С | 690, 730 | 690, 730 | 690, 730 | 690, 730 | |
| А-1530 infection | 20°С | 690, 730 | 690, 730 | 690, 730 | 690, 730 |
| –196°С | 690, 730 | 690, 730 | 690, 730 | 690, 730 | |
At the same time, it should be noted that the control (uninfected with the pathogen) plants of all cotton genotypes used in the experiments were characterized by a constant position of the maxima of the fluorescence spectra during the entire period (from 3 to 11 days) of measuring the spectra, as was shown earlier (Khotamov et al., 2020) using the example of the susceptible cultivar S-4727.
The experimental results presented in Fig. 1 show a significant change in the ratio I690/I730 of the LICF spectra of the leaves of infected plants of the extremely susceptible cultivar Ibrat, measured at 20°C and –196°С, which in 11 days after infection increased in comparison with the control by 4 and 5.6 times, respectively. Infection of plants of the moderate-resistant cotton cultivars Bukhora-6 and Sulton also affect the ratio I690/I730, which changes in comparison with the control by 2 and 1.4 times at room and low temperatures, while in the case of the susceptible cultivar S-4727 these figures were, respectively, 3.9 and 6.4. At the same time, the maximum shift (by 5 nm) of the low-temperature spectra was observed only on the 8th day after infection of plants of the moderate-resistant cotton cultivars, while in the case of extremely susceptible and susceptible varieties, a similar shift in the spectrum began on the 5th day and reached its maximum value (about 10 nm) by 11 days after infection. There were no changes in the parameters of the LICF spectra of infected plants of the resistant cultivars Ishonch and Gulbahor-2.
Fig. 1.
Influence of artificial infection of plants with the causative agent of Verticillium wilt on the intensity ratio at 690 and 730 nm (I690/I730) of the spectra of laser-induced chlorophyll fluorescence of leaves of various cotton cultivars: (A) – Ibrat, (B) – S-4727, (C) – Bukhoro-6, (D) – Sulton, (E) – Ishonch, (F) – Gulbahor-2; 1, 2 – LICF spectra were measured at room temperature (20°C); 3, 4 – at liquid nitrogen temperature (–196°C). 1, 3 – control, uninfected plants, 2, 4 – infected plants; 3, 5, 8, 11 – days after plant infection. The confidence interval of the mean values was at least 95% (P ≤ 0.05).
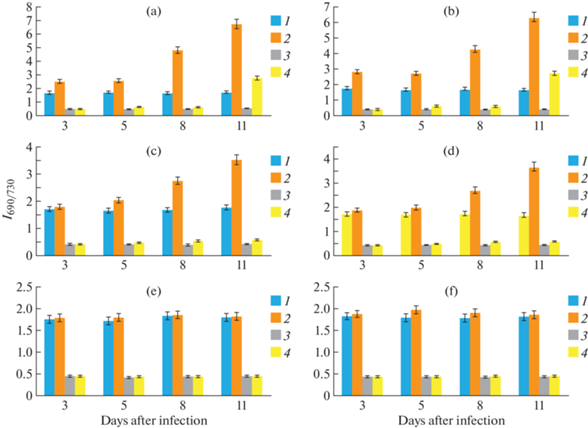
Similar changes in the parameter I690/I730 were found during infection of plants of various lines of the cotton Genetics collection (Fig. 2). At the same time, the smallest changes in comparison with the control were recorded at the sample A-1431 (2.3 and 1.4 times), and the samples A-1423 and A-1428 were characterized by 4 and 6-fold changes in this parameter at two temperatures modes, respectively. It should be noted that the value of the I690/I730 ratio for healthy (uninfected) plants of all the accessions of cotton Genetics collection used in experiments remained almost unchanged, slightly varying within the measurement error throughout the entire period of measuring fluorescence spectra (from 3 to 11 days).
Fig. 2.
Influence of artificial infection of plants with the causative agent of Verticillium wilt on the intensity ratio at 690 and 730 nm (I690/I730) of the spectra of laser-induced chlorophyll fluorescence of leaves of various cotton lines: (a) – A-1423, (b) – A-1428, (c) – A-1431, (d) – A-1530; 1, 2 – LICF spectra were measured at room temperature (20°C), 3, 4 – at liquid nitrogen temperature (–196°C); 1, 3 – control, uninfected plants; 2, 4 – infected plants; 3, 5, 8, 11 – days after plant infection. The confidence interval of the mean values was at least 95% (P ≤ 0.05).

The above data demonstrate the possibility of using the parameters of the chlorophyll fluorescence spectra of leaves to determine the resistance of cotton genotypes to damage by the causative agent of Verticillium wilt. In our case, the change in the ratio of the maximum intensities of the LICF I690/I730 spectra measured at room temperature and at the temperature of liquid nitrogen, as well as the shift to the short-wavelength region of the low-temperature spectra of the leaves of plants infected with the causative agent of Verticillium wilt, makes it possible to differentiate the cultivars and lines used in the experiment according to the level of wilt resistance.
To determine the LICF index, which most accurately characterizes the degree of wilt resistance of cotton genotypes, was made a comparison of the parameters of the fluorescence spectra of cultivars and accessions of the Genе collection of IGEBR.
The analysis of the investigated parameters of the LICF showed (Fig. 3) that the infection of plants of such genotypes as cultivars Ibrat, S-4727 and the accession of the gene collection A-1423, leads to the greatest change in the ratio I690/I730 of the spectra measured at room temperature and liquid nitrogen temperature by 280–300 and 450–540%, respectively. The greatest shift in the maxima of the low-temperature fluorescence spectra of leaves in the genotypes of this group was recorded within 7–10 nm. A similar shift in the spectrum to the short-wavelength region by 7–10 nm was observed in the case of the accessions of the Genetics collection A-1428 (see Table 1), and the change in the I690/I730 indices was within the range of changes noted for the susceptible genotypes. In the groups of moderate-resistant cultivars (Bukhara-6, Sulton) and the accession of the genetics collection (A-1431), similar indicators varied within 100–125 and 40%, and the maximum shift of the fluorescence spectra for all genotypes was recorded within 5 nm. There were no changes in the spectral parameters of resistant cultivars and accession of the gene collection.
Fig. 3.
Influence of plant infection on maximum changes in the parameter of laser-induced fluorescence spectra (∆I690/I730, %) of leaves of various cotton genotypes; 1 – LICF spectra were measured at room temperature (20°C); 2 – at liquid nitrogen temperature (–196°C). The confidence interval of the mean values was at least 95% (P ≤ 0.05).
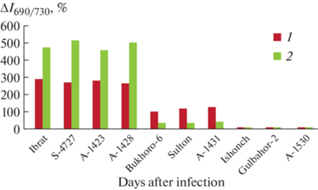
Thus, the fluorescence study of wilt resistance of various cultivars and accession of the Gene collection made it possible to confirm the data obtained in the study of the hypersensitivity reaction of the tissues of infected plants, and in the case of accession A-1428, to correct the degree of its wilt resistance and assign this cotton genotype to the susceptible group. At the same time, taking into account the significant scatter of the change in the ratio of the spectral intensities at 690 and 730 nm (∆I690/I730) in genotypes belonging to the same group, the main indicator that characterizes the degree of wilt resistance with maximum accuracy is the shift in the maximums of the low-temperature LICF spectra of the leaves of infected plants. According to the variability of this indicator under conditions of wilt damage to plants, the studied cultivars and accessions of the Gene collection of the IGEBR, according to the degree of wilt resistance, were assigned to the following groups: Ibrat, C-4727, A-1423, A-1428 – susceptible, Bukhara-6, Sulton, A-1431 – moderate resistant, Ishonch, Gulbahor-2, A-1530 – resistant.
Confirmation of the regularity of the gradation of the degree of wilt resistance of the studied genotypes that we carried out is the presence of certain dependencies between the levels of changes in the parameters of the LICF spectra of leaves and phytoalexin formation in the tissues of cotton plants infected with the causative agent of Verticillium wilt. Calculation of the Pearson correlation coefficient (rp) between the content of IHG as the main phytoalexin, which determines the effectiveness of the reaction of cotton hypersensitivity to the phytopathogen, and the magnitude of the shift in the maxima of low-temperature fluorescence spectra made it possible to establish the value rp = –0.90 with an average error of the correlation coefficient mr = 0.055. Thus, a high negative correlation was revealed between the compared indices of resistance of different cotton genotypes to the causative agent of Verticillium wilt: the smaller the shift in the maxima of the LICF spectra of the leaves of infected plants, the higher the efficiency of the hypersensitivity reaction, determined by the level of phytoalexins content in their tissues. Conversely, genotypes with a low level of IHG synthesis in infected tissues are characterized by the largest shift in the fluorescence spectra. In addition, a fairly high correlation dependence (rp = –0.79 ± 0.114) was revealed between the change in the intensity ratio at 690 and 730 nm (∆I690/I730) of the LICF spectra of leaves of plants infected with the pathogen of various cotton genotypes and the level of phytoalexin formation, which indicates the legitimacy of the use of the method of laser-induced chlorophyll fluorescence for an accurate assessment of the degree of resistance of the studied cotton genotypes to the causative agent of Verticillium wilt, the fungus V. dahliae.
DISCUSSION
As noted in a number of works, unfavorable environmental factors, in most cases, lead to inhibition of the process of photosynthesis, which is effectively controlled by the method of laser-induced chlorophyll fluorescence of plant leaves (Fateeva, Matvienko, 2004; Belasque et al., 2008, Grishaev, Salnikova, 2010). The effectiveness of such control is due to changes in the shape of the fluorescence spectrum of plants caused by the influence of a stress factor (Veselovsky, Veselova, 1990; Fedotov et al., 2016). It has been shown that the identifying factor for stress states of plants is the ratio of the intensities of fluorescent radiation at wavelengths of 680 and 740 nm (Gorodnichev et al., 2015).
The results of our studies also showed changes in the parameters of the LICF spectra, such as the position of the maxima (λm) and the intensity ratio I690/I730 of the spectra of infected plants. At the same time, the dependence of the magnitude of the shift in the maxima and the ratio I690/I730 on the degree of plant infection, which varied in cotton genotypes differing in wilt resistance, was revealed. The greatest change in the shape and position of the LICF spectrum, determined by the values of the parameters λm and I690/I730, is characteristic of the genotypes susceptible to the disease, the absence of changes is for the resistant ones, and the moderate-resistant cultivars and accessions of the gene collection are characterized by moderate changes in the LICF parameters of the leaves of the pathogen-infected cotton plants. It is important to note that the changes in the characteristics of the LICF spectra revealed by us appear already in the early stages of infection, which corresponds to the results of studies described in a number of works (Pascual et al., 2010; Martinez-Ferri et al., 2016; Babar et al., 2018; Chávez-Arias et al., 2019) and may be associated with the high sensitivity of membrane processes of ATP synthesis to fungal toxins (Matorin et al., 2018). In addition, our data allow us to distinguish three phases of the development of cotton wilt disease, the first of which is characterized by a slight shift in the low-temperature spectrum of LICF and an insignificant change in the I690/I730 ratio. Such changes, apparently, are associated with reversible changes in the fluorescence of leaves, indicating the primary response of the photosynthetic apparatus to the introduction and spread of the infectious agent in the plant (Veselovsky, Veselova, 1990; Tartachnyk, 2006). The data of our studies indicate the absence of sharp changes in the parameters of fluorescence in the second phase, which the authors of the above work call “the period of imaginary well-being”. The most profound changes in LICF occur in the last, third phase, most likely associated with the complete destruction of the photosynthetic apparatus (Veselovsky, Veselova, 1990). At the same time, it is necessary to highlight the fact of the almost complete absence of phase 1 of the development of the disease in moderately resistant genotypes, which, in our opinion, may be another sign of determining the resistance of cotton to damage by Verticillium wilt.
Thus, the results of our studies made it possible to investigate the variety-specificity of resistance of various cotton genotypes to damage by the causative agent of Verticillium wilt using the LICF method and establish that the most informative and accurate indicator is the shift in the maxima of the low-temperature spectra of LICF to the short-wavelength side. Genotypes characterized by a change in the position of the maxima of ILPC by 7–10 nm are susceptible, up to 5 nm – are moderate resistant, and in the case of absence of shifts – resistant.
It should be noted that fluorescence diagnostics differs from the traditionally used methods in its simplicity, shorter time for examining accessions and high accuracy in determining the final result, namely, the degree of wilt resistance of various cotton genotypes.
Список литературы
Agishev V.S., Khusainov I.A., Zinoviev A.V. et al. Investigation of the spectral and temporal characteristics of the luminescence of higher plants upon excitation by laser radiation with various energy and time parameters. Uzbekskiy biologicheskiy zhurnal. 2002. № 5–6. P. 80–83 (in Russ.).
Akhmedzhanov I.G., Agishev V.S., Dzholdasova K.B. et al. The use of a portable fluorimeter to study the effect of water deficit on the characteristics of delayed fluorescence of cotton leaves. Doklady Academii nauk Uzbekistana. 2013. № 3. P. 58–60 (in Russ.).
Akinshina N.G., Rashidova D.K., Azizov A.A. Seed encapsulation in chitosan and its derivatives restores levels of chlorophyll and photosynthesis in wilt-affected cotton (Gossypium L., 1753) plants. Selskokhozyaistvennaya biologiya. 2016. V. 51 (5). P. 696–704 (in Russ.). https://doi.org/10.115389/agrobiology.2016.5.696eng
Aleynikov A.F., Mineev V.V. Effect of the fungus of Ramularia tulasnei Sacc. on chlorophyll fluorescence in garden strawberry. Sibirskiy vestnik selskokhozyaistvennoy nauki. 2019. V. 49 (2). P. 94–102 (in Russ.).
Avazkhodzhaev M.Kh., Zeltser S.S. Physiological factors of cotton wilt resistance. Fan, Tashkent, 1980 (in Russ.).
Avazkhodzhaev M.Kh., Zeltser S.S., Nuritdinova H. et al. Phytoalexins as a factor in wilt resistance of cotton. In: Handbook of phytoalexin metabolism and action. N.Y., Basel, Hong Kong, Marcel Dekker Inc., 1995, pp. 129−160.
Babar M.A., Saleem M., Hina A. et al. Chlorophyll as biomarker for early disease diagnosis. Laser Physics. 2018. V. 28 (6). P. 158–163.
Belasque J., Gasparoto M.C.G., Marcassa L.G. Detection of mecanical and disease stresses in citrus plants by fluorescence spectroscopy. Appl. Opt. 2008. V. 47 (11). P. 1922–1926.
Belov M.L., Bullo O.A., Fedotov Yu.V. et al. Laser method for vegetation monitoring. Vestnik MGTU. Ser. Priborostroeniye. 2015. № 2. P. 71–82 (in Russ.).
Chavez-Arias S.S., Gomez-Caro S., Restrepo-Diaz H. Physiological, biochemical and chlorophyll fluorescence parameters of Physalis peruviana L. seedlings exposed to different short-term waterlogging periods and Fusarium wilt infection. Agronomy. 2019. V. 9 (5). P. 213–218.
Dospekhov B.A. Field experiment technique (with the basics of statistical processing of research results). Agropromizdat, Moscow, 1985 (in Russ.).
Fateeva N.L., Matvienko G.G. Application of the method of laser-induced fluorescence. Proc. SPIE. 2004. V. 5232. P. 652–657.
Fedotov Yu.V., Bullo O.A., Belov Ì.L. et al. Stability of results of plant state detection by laser fluorescence method. Optika atmosfery i okeana. 2016. 29 (1). P. 80–84 (in Russ.). https://doi.org/10.15372/A0020160110
Goltsev V.N., Kaladzhi M.Kh., Kuzmanova M.A. et al. Variable and delayed fluorescence of chlorophyll a – theoretical basics and practical application in plant investigations, Moscow, Izhevsk, 2014 (in Russ.).
Gorodnichev V.A., Belov M.L., Bolvachev V.V. et al. Plants stress statuses control at initiation of fluorescence in UV spectral range. Contenant. 2015. № 2. P. 47–55.
Grishaev M.V., Salnikova N.S. A setup for remote recording of the spectrum of laser-induced fluorescence from crowns of woody plants. Instrum. Experim. Techn. 2010. V. 53 (5). P. 746–749.
Israeli V.P., Shklyar S.N., Beltyukova K.I. et al. A guide for studying bacterial plant diseases. General issues. Kolos, Moscow, 1968 (in Russ.).
Khotamov M.M., Redzhapova M.M. Resistance of the variety diversity Gossypium hirsutum L. species to Verticillium wilt. Int. J. Innov. Res. Multidicipl. Field. 2019. V. 5 (5). P. 78–80.
Khotamov M.M., Agishev V.S., Akhmedzhanov I.G. Influence of Verticillium wilt infection on the functional activity of the cotton photosynthetic apparatus. Mikologiya i fitopatologiya. 2020. V. 54 (5). P. 340–346.
Khotamov M.M., Akhmedzhanov I.G. Study of Verticillium wilt pathogenesis in different cotton genotypes. Mikologiya i fitopatologiya. 2021. V. 55 (2). P. 148–154.
Korneev D.Yu. Information possibilities of the method of inducing fluorescence of chlorophyll. Alterpres, Kiev, 2002 (in Russ.).
Kshirsagar A., Reid A.J., McColl S.M. et al. The effect of fungal metabolites on leaves as detected by chlorophyll fluorescence. New Phytologist. 2001. V. 151 (2). P. 451–457.
Kuckenberg J., Tartachnyk I., Noga G. Temporal and spatial changes of chlorophyll fluorescence as a basis for early and precise detection of leaf rust and powdery mildew infections in wheat leaves. Precis. Agric. 2009. V. 10 (1). P. 34–44.
Mandal K., Saravanan R., Maiti S. et al. Effect of downy mildew disease on photosynthesis and chlorophyll fluorescence in Plantago ovata Forsk. J. Plant Dis. Prot. 2009. V. 116. (4). P. 164–168.
Martinez-Ferri E., Zumaquero A., Ariza M.T. et al. Nondestructive detection of white root rot disease in avocado root-stocks by leaf chlorophyll fluorescence. Plant Dis. 2016. V. 100. P. 49–58.
Matorin D.N., Rubin A.B. Chlorophyll fluorescence in algae and higher plants, Izhevsk, Moscow, 2012 (in Russ.).
Matorin D.N., Timofeev N.P., Glinushkin A.P et al. Application of the fluorescence method for investigating the influence of root rot pathogen Bipolaris sorokniana on photosynthetic light reactions in wheat plants. Vestnik Moskovskogo universiteta. Seria 16. Biologiya. 2018. V. 73 (4). P. 247–253 (in Russ.).
Pascual I., Azcona I., Morales F. et al. Photosynthetic response of pepper plants to wilt induced by Verticillium dahliae and soil water deficit. J. Plant Physiol. 2010. V. 167 (9). P. 701–708.
Posudin Yu.I., Godlevska O.O., Zaloilo I.A. et al. Application of portable fluorometer for estimation of plant tolerance to abiotic factors. Int. Agrophysics. 2010. V. 24 (4). P. 363–368.
Ptushenko V.V., Ptushenko O.S., Tikhonov A.N. Induction of chlorophyll fluorescence, chlorophyll content and leaf color characteristics as indicators of the aging of the photosynthetic apparatus in woody plants. Biokhimiya. 2014. V. 79 (3). P. 260–272 (in Russ.).
Rai M.K., Shende S., Strasser R.J. JIP test for fast fluorescence transients as a rapid and sensitive technique in assessing the effectiveness of arbuscular mycorrhizal fungi in Zea mays: Analysis of chlorophyll a fluorescence. Plant Biosyst. 2008. V. 142 (2). P. 191–198.
Romanov V.A., Galeluka I.B., Sakharan E.V. Portable fluorimeter and features of its application. Sensornaya elektronika i mikroskopicheskiye tekhnologii. 2010. V. 1 (7). P. 146–152 (in Russ.).
Tartachnyk I.I., Rademacher I., Khbauch W. Distinguishing nitrogen deficiency and fungal infection of winter wheat by laser-induced fluorescence. Precis. Agric. 2006. V. 7 (4). P. 281–293.
Veselovsky V.A., Veselova T.V. Luminescence of plants. Theoretical and practical aspects. Nauka, Moscow, 1990 (in Russ.).
Yan K., Han G., Ren C. et al. Fusarium solani infection depressed photosystem performance by inducing foliage wilting in apple seedlings. Front. Plant Sci. 2018. V. 9. P. 479–486.
Yi F., Ramaraja P. Current and prospective methods for plant disease detection. Review. Biosensors. 2015. V. 5 (3). P. 537–561.
Zhurbitsky Z.I. Theory and practice of the vegetative method. Nauka, Moscow, 1968 (in Russ.).
Авазходжаев М.Х., Зельцер С.Ш. (Avazkhodzhaev, Zeltser) Физиологические факторы вилтоустойчивости хлопчатника. Ташкент: Фан, 1980. 122 с.
Агишев В.С., Хусаинов И.А., Зиновьев А.В. и др. (Agishev et al.) Исследование спектральных и временных характеристик люминесценции высших растений при возбуждении лазерным излучением с различными энергетическими и временными параметрами // Узбекский биологический журнал. 2002. № 5–6. С. 80–83.
Акиншина Н.Г., Рашидова Д.К., Азизов А.А. (Akinshina et al.) Капсулирование семян препаратами хитозана и его производных восстанавливает фотосинтез у растений хлопчатника (Gossypium L., 1753) на фоне вилта // Сельскохозяйственная биология. 2016. Т. 51 (5). С. 696–704.
Алейников A.Ф., Минеев В.В. (Aleynikov, Mineev) Влияние гриба Ramularia tulasnei Sacc. на флуоресценцию хлорофилла садовой клубники // Сибирский вестник сельскохозяйственной науки. 2019. Т. 49. С. 94–102.
Ахмеджанов И.Г., Агишев В.С., Джолдасова К.Б. и др. (Akhmedzhanov et al.) Применение портативного флуориметра для исследования влияния водного дефицита на характеристики замедленной флуоресценции листьев хлопчатника // Доклады Академии наук Республики Узбекистан. 2013. № 3. С. 58–60.
Белов М.Л., Булло О.А., Федотов Ю.В. и др. (Belov et al.) Лазерный метод контроля состояния растений // Вестник МГТУ им. Н.Э. Баумана. Сер. Приборостроение. 2015. № 2. С. 71–82.
Веселовский В.А., Веселова Т.В. (Veselovskym Veselova) Люминесценция растений. Теоретические и практические аспекты. М.: Наука, 1990. 176 с.
Гольцев В.Н., Каладжи М.Х., Кузманова М.А. и др. (Goltsev et al.) Переменная и замедленная флуоресценция хлорофилла a – теоретические основы и практическое приложение в исследовании растений. М.; Ижевск: ИКИ-РХД, 2014. 220 с.
Доспехов Б.А. (Dospekhov) Методика полевого опыта (с основами статистической обработки результатов исследований). М.: Агропромиздат, 1985. 351 с.
Журбицкий З.И. (Zhurbitsky) Теория и практика вегетационного метода. М.: Наука, 1968. 268 с.
Израильский В.П., Шкляр С.Н., Бельтюкова К.И. и др. (Izrailsky) Руководство для изучения бактериальных болезней растений. Общие вопросы. Москва: Колос, 1968. 343 с.
Корнеев Д.Ю. (Korneev) Информационные возможности метода индукции флуоресценции хлорофилла. Киев: Альтерпрес, 2002. 188 с.
Маторин Д.Н., Рубин А.Б. (Matorin, Rubin) Флуоресценция хлорофилла высших растений и водорослей. М.; Ижевск: ИКИ-РХД, 2012. 256 с.
Маторин Д.Н., Тимофеев Н.П., Глинушкин А.П. и др. (Matorin et al.) Исследование влияния грибковой инфекции Bipolaris sorokoniana на световые реакции фотосинтеза пшеницы с использованием флуоресцентного метода // Вестник Московского университета. Серия 16. Биология. 2018. Т. 73. С. 247–253.
Птушенко В.В., Птушенко О.С., Тихонов А.Н. (Ptushenko et al.) Индукция флуоресценции хлорофилла, содержание хлорофилла и характеристики цветности листьев как показатели старения фотосинтетического аппарата у древесных растений // Биохимия. 2014. Т. 79. С. 260–272.
Романов В.А., Галелюка И.Б., Сахаран Е.В. (Romanov et al.) Портативный флуориметр и особенности его применения // Сенсорная электроника и микроскопические технологии. 2010. Т. 1. С. 146–152.
Федотов Ю.В., Булло О.А., Белов М.Л. и др. (Fedotov et al.) Устойчивость результатов лазерного флуоресцентного метода контроля состояния растений // Оптика атмосферы и океана. 2016. Т. 29. № 1. С. 80–84.
Дополнительные материалы отсутствуют.
Инструменты
Микология и фитопатология